How to Build Enterprise Value
How to Build Enterprise Value

Natalie Luneva
December 25, 2025


Enterprise value measures a company’s total worth. It combines market capitalization, debt, and cash. It gives a fuller picture than a simple stock price, because it accounts for leverage and liquidity that shape real valuation.
Enterprise value is a measure of a company’s total economic worth, reflecting what a buyer would effectively pay to acquire the business after accounting for debt and available cash. Unlike market capitalization, which looks only at equity, enterprise value captures the full capital structure and therefore aligns more closely with how investors, acquirers, and advisors assess real value in practice.
That practical relevance is reflected in how valuation work is actually done: enterprise value–based multiples are used in roughly 60% of valuation cases, underscoring how central EV has become in comparing businesses, pricing acquisitions, and evaluating strategic decisions.
Enterprise value ties operating performance, capital structure, and liquidity into a single metric, and provides a clearer, decision-ready view of what a company is truly worth and where management actions can meaningfully increase that worth over time.
Enterprise value is the total amount payable to all capital providers. It combines market capitalization, total debt, and cash and cash equivalents. Preferred shares and minority interest are included when applicable.
Market cap reflects only the stock price and share count. That can miss obligations or reserves that change true economic worth.
Equity value sits below enterprise figures and is derived by subtracting net debt and non-common claims from the enterprise number.
This measure is capital structure-neutral, so it lets investors and managers compare companies with different leverage and cash mixes. In M&A, buyers focus on the amount required to acquire the business inclusive of debt and net of cash.
EV underpins ratios like EV/EBITDA, linking operating earnings to purchase price. Watch how changes in debt, cash, or market price shift the metric and communicate the impact to shareholders.
.webp)
To know what a buyer would pay, you must merge market data with a company's debt and cash positions.
Standard formula: Enterprise Value = Market Capitalization + Total Debt − Cash and Cash Equivalents. Add preferred equity and minority interest when present.
Subtracting cash reflects the net position. Cash can reduce outstanding debt, so the net amount better shows what an acquirer effectively assumes.
Pull inputs from financial statements and market feeds at the same timestamp. Document all assumptions so the model is repeatable and auditable.
Use this enterprise value figure later as the numerator for EV/EBITDA comparisons and update it around earnings, debt moves, or large cash changes.
Multiples that use enterprise measures reveal how debt and cash change the story behind earnings. These ratios align market pricing with operating performance and help compare firms with different leverage.
EV/EBITDA compares enterprise value to operating cash earnings before non-cash items. It suits capital-intensive companies and those with different degrees of financial leverage.
EBITDA composition: Net income + interest expense + taxes + depreciation + amortization. Reconcile this to financial statements for consistent analysis.
Watch the limits: EBITDA can overstate cash when working capital grows and it ignores capital expenditures. In such cases, consider EBIT or free cash flow.
EV/Sales adds debt and cash into a revenue multiple, so it is broader than price/sales. Use it when earnings are negative but revenue is meaningful.
Because enterprise can be negative if cash exceeds market cap plus debt, interpret EV/Sales with care and normalize for non-recurring items.
EV-based multiples and P/E look at different slices: the former captures total claims; the latter shows equity-level price relative to net income.
Investors should triangulate EV/EBITDA, EV/Sales, and P/E with free cash flow metrics to form a robust valuation view across market and industry peers.
Quick example concept: If cash rises or debt falls, the enterprise amount drops and EV/EBITDA falls even if EBITDA is unchanged. That move alters relative valuation and investor perception.
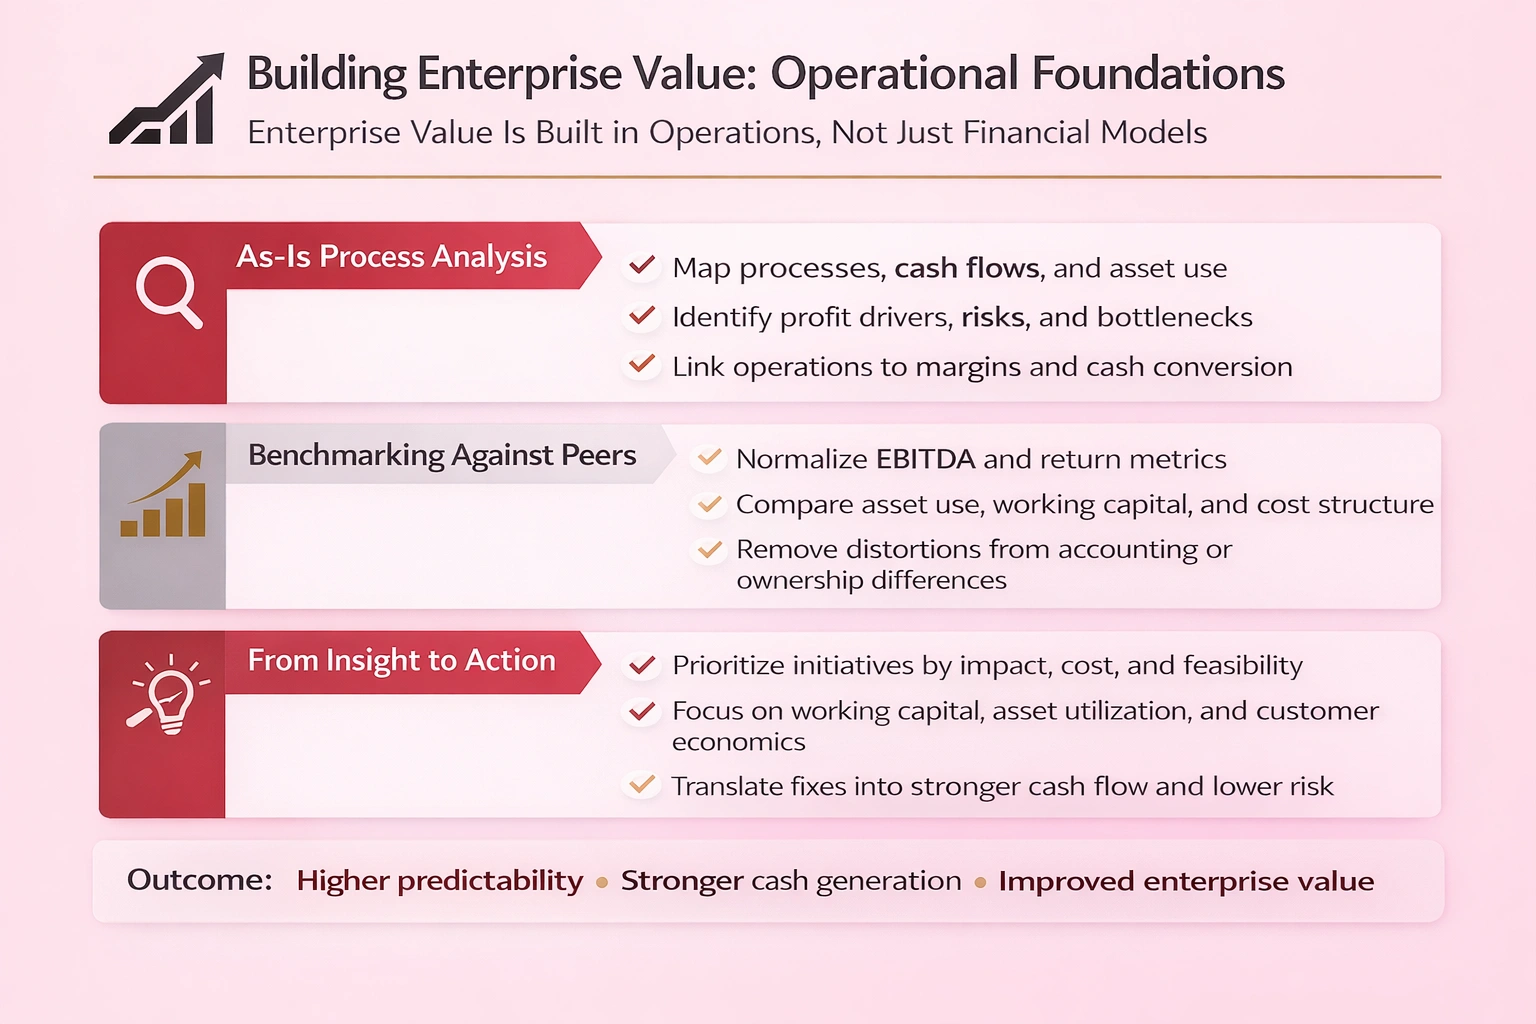
A clear as-is review reveals which operations drive profit and which ones quietly erode company returns.
Start with a factual baseline that maps processes, cash flows, and asset use across the company. Review working capital, supply chain, customer economics, vendor terms, and maintenance of assets.
Quantify bottlenecks and tie findings to margins, cash conversion, and cost of capital. That makes operational problems measurable and management-ready.
Compare normalized metrics against industry peers to avoid distortions from leased versus owned assets or one-off accounting items. Use comparable EBITDA and return measures.
From those comparisons, prioritize improvement opportunities by impact, cost, and feasibility. Engage cross-functional teams so fixes reflect real operational constraints.
These steps prepare management for the next section on designing KPIs and high-impact moves that increase market standing and long-term returns.
Turn analysis into action and choose metrics that directly move cash, risk, and profit margins.
Pick KPIs that map to the levers that change enterprise value. Score initiatives by impact, cost, and time to get a clear priority list.
Include executive, valuation, and departmental voices when you score. This keeps capital and management attention focused on high-return moves.
Start with working capital: tighten receivables, cut excess inventory, and stretch payables where appropriate to free cash.
Apply cost discipline next: renegotiate vendor terms, remove structural waste, and digitize processes to sustain margin gains.
Consistent progress in these KPIs strengthens cash flow, lowers net risk, and raises market perception of company performance. Section 9 outlines cadence and governance, and shows how Great to Elite helps teams operationalize these moves.
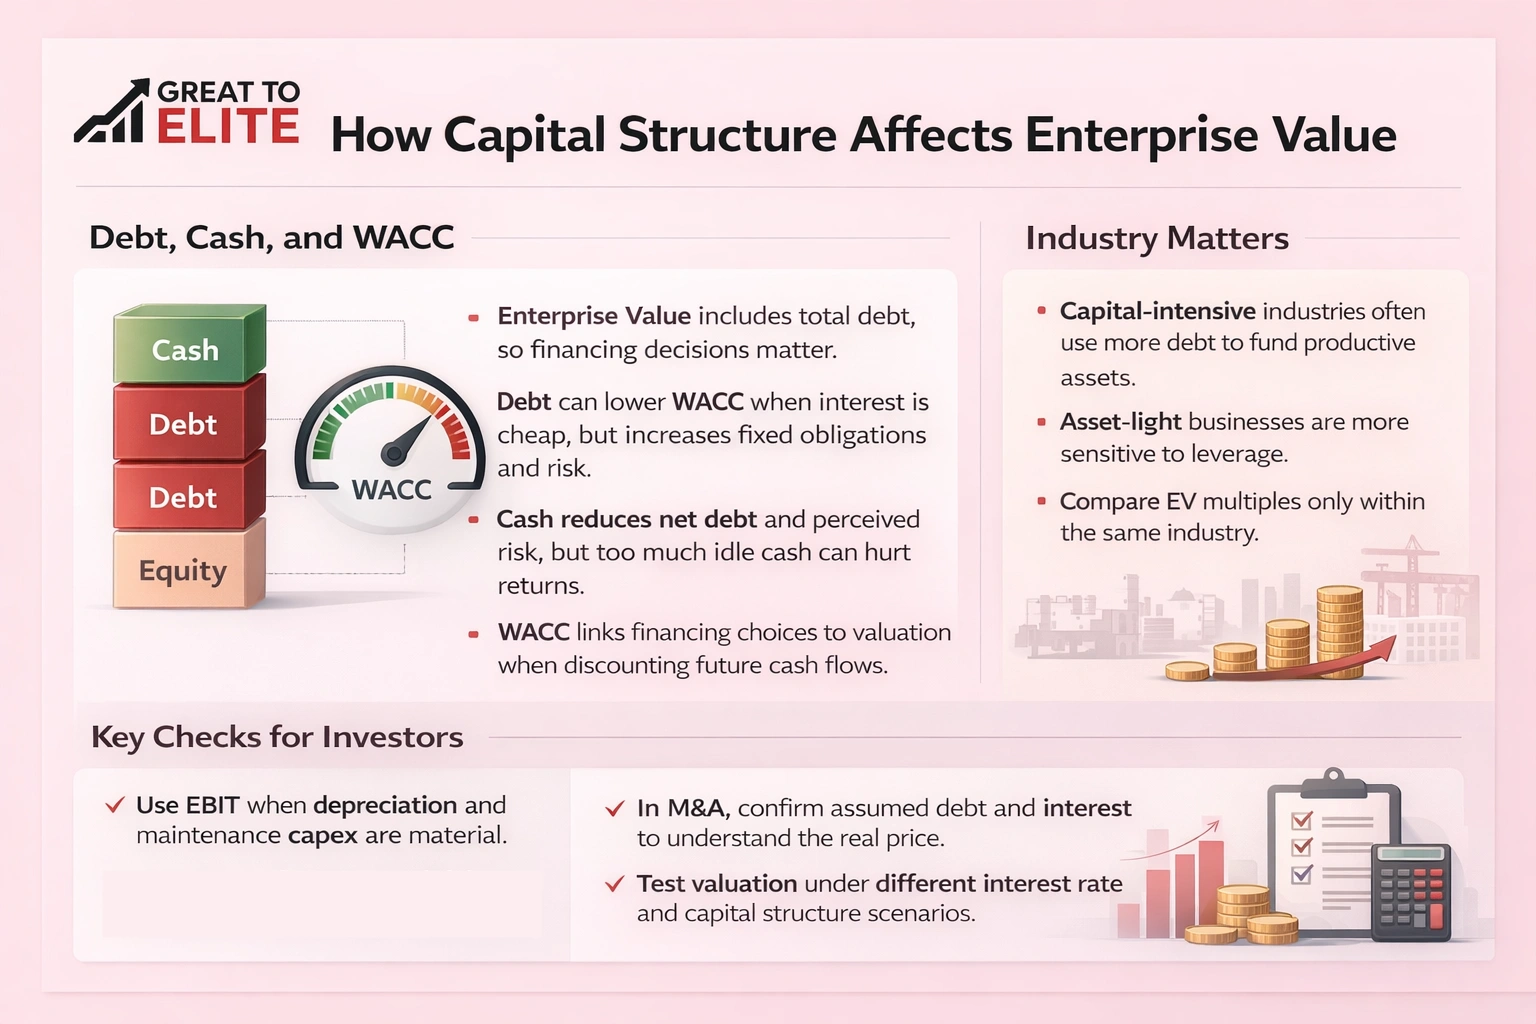
Financing choices, how much to borrow, hold in reserve, or raise from shareholders, change risk and return in measurable ways.
EV includes total debt, so how management uses borrowing matters for valuation and risk. Debt can lower the weighted average cost of capital when interest is cheap, but it increases fixed obligations.
Cash reduces net obligations, can lower WACC, and reduce perceived risk. Too much idle cash, however, may drag returns and signal missed reinvestment chances.
Connect financing choices to WACC when discounting future cash flows: debt carries interest and rank, while equity expectations drive the cost of shareholders’ claims.
In capital-intensive sectors, high debt often funds productive assets and sensible growth. In asset-light models, similar leverage can strain cash generation and threaten solvency.
Compare multiples only within the same industry. Differences in depreciation, taxes, and asset lives distort cross-sector EV multiples and can mislead investors.
Be transparent with shareholders and investors about financing strategy and expected effects on enterprise metrics. Discipline in debt, equity, and cash policies preserves optionality and improves the odds that a company remains a strong value company through cycles.
Trackable milestones and regular reviews turn strategic plans into measurable market outcomes.
Schedule valuation checkups annually when performance is steady and quarterly during major change. Focus reviews on ebitda, cash flow, and working capital turns.
Use an EV dashboard that displays ebitda, cash, receivables days, inventory turns, debt levels, and net income trends. Tie each metric to clear corrective steps and owners.
Run two scenario models. For capital-intensive companies, show how asset purchases and higher debt affect cash and the cost of capital.
For asset-light companies, model recurring revenue and low maintenance capex to reveal how steady cash lifts equity value and market multiples.
Great to Elite supports rapid execution with:
Book a call to align capital planning, test scenario models, and accelerate measurable improvements in market perception and company performance.
When leaders link disciplined KPIs to capital choices, the path to stronger market metrics and cash generation becomes clear.
he practical moves focus on improving cash flow, reducing risk, and delivering credible growth that investors can trust.
Compare metrics within industry peers, refresh models as cash, debt, and market price change, and run scenario tests regularly. Tie daily execution to KPIs so every team sees how actions affect company performance and equity outcomes.
Use the cadence and governance shown earlier to monitor progress. Book time with Great to Elite to convert these steps into a structured plan that raises enterprise value and long‑term market standing.
