What Is Enterprise Value
What Is Enterprise Value

Natalie Luneva
December 12, 2025
.webp)


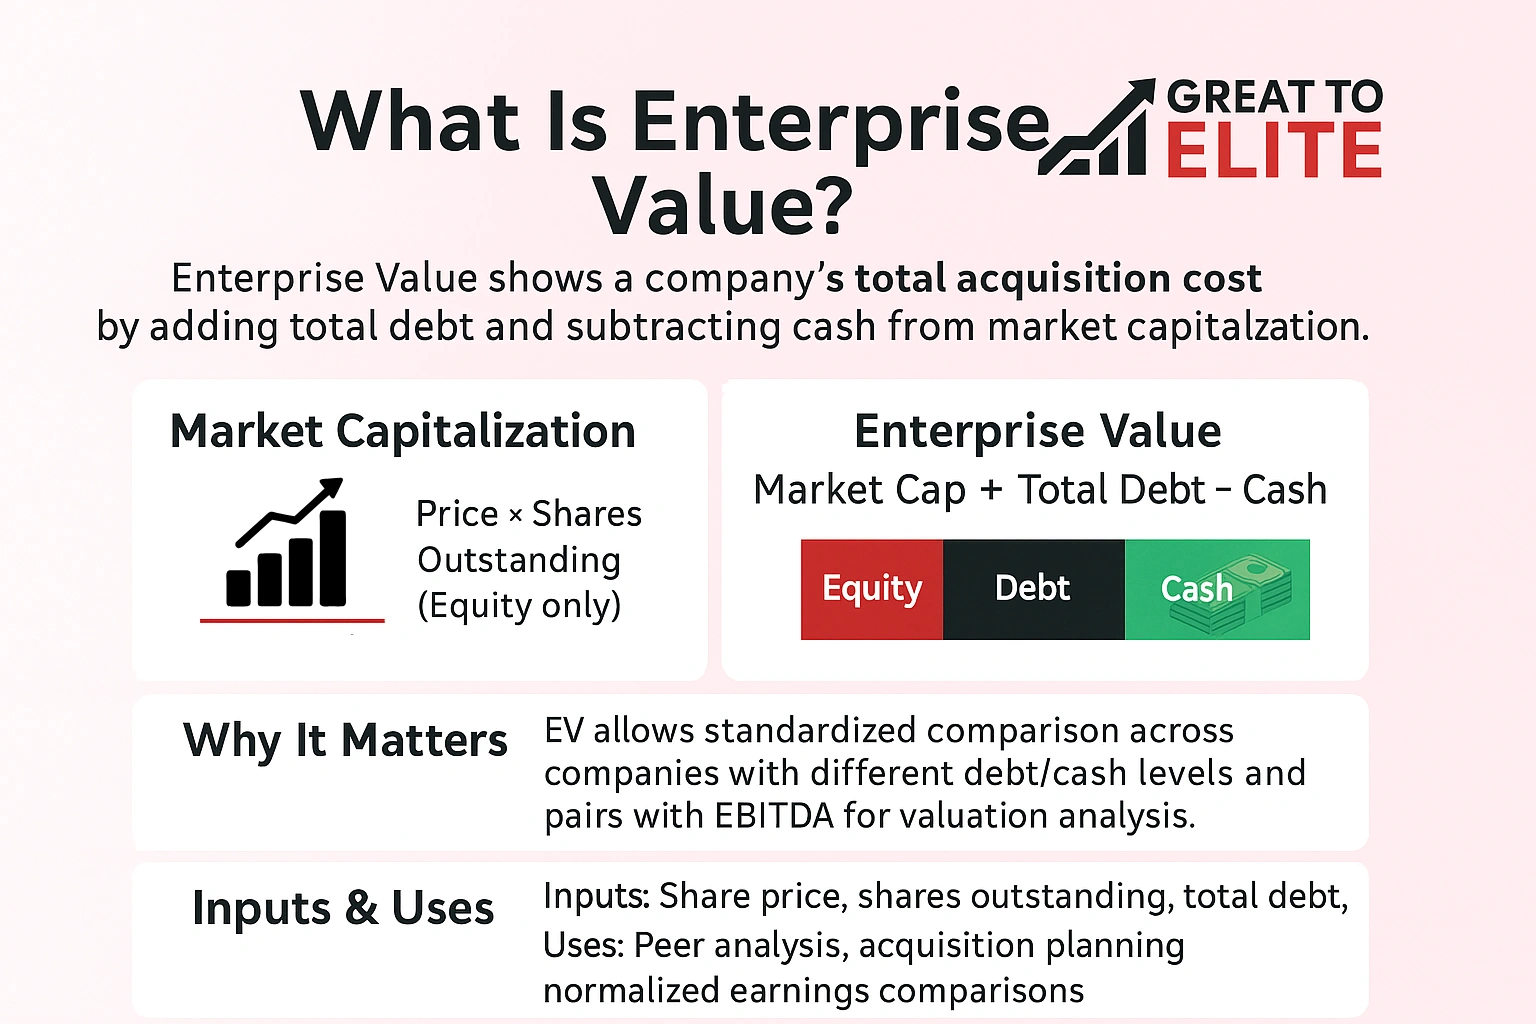
Enterprise value measures a company’s total worth by adding market capitalization and total debt, then subtracting cash and cash equivalents.
You use figures from the balance sheet and market prices to get this metric. It shows the full cost to buy a business, since a buyer would assume debt and receive any cash on hand.
Compared with market capitalization alone, this approach gives a broader view of market value. Investors often lean on EV to build ratios like EV/EBITDA or EV/Sales for clearer valuation across peers. For example, the global median EV/EBITDA multiple for M&A transactions in 2025 is 9.3x.
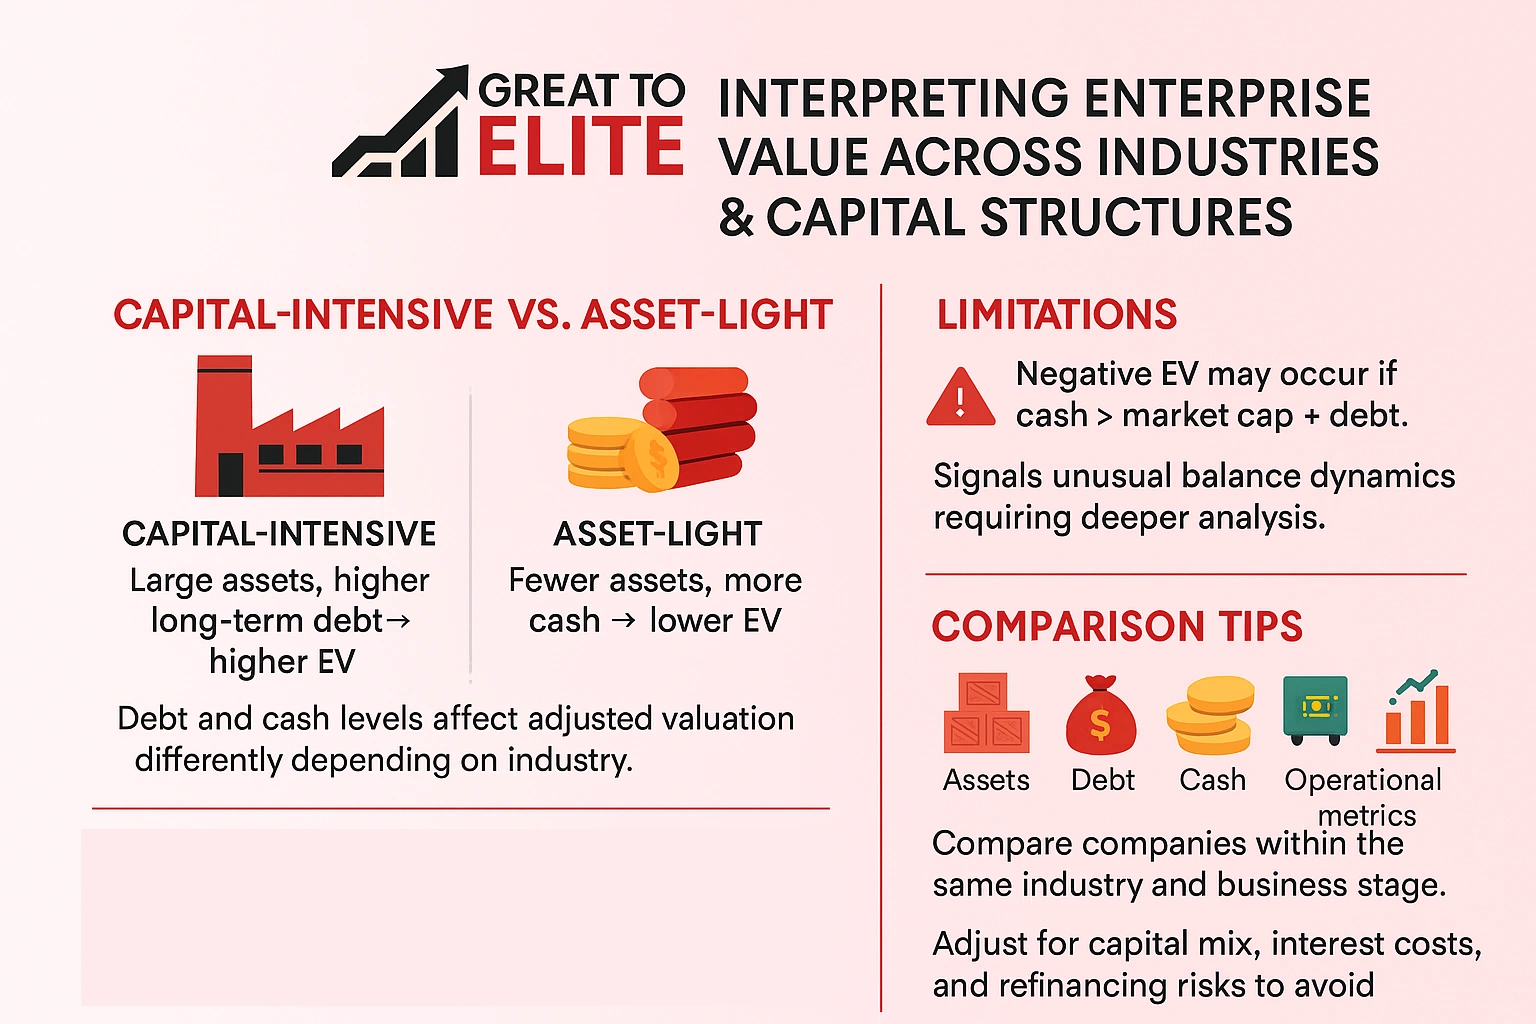
In rare cases, total value can be negative when cash exceeds market cap plus debt. That signals excess cash or unusual capital structure and should prompt closer analysis.
To see true acquisition cost, adjust the share-based price by the firm's borrowings and liquidity.
This measure goes beyond market capitalization by adding total debt and subtracting cash from the equity market price. That process uses the current share price and shares outstanding for the market figure, then pulls debt and cash from the balance sheet.
Market capitalization reflects price times shares outstanding and focuses only on equity. It leaves out debt and cash held by the company.
By contrast, enterprise value includes debt and subtracts cash, giving a fuller view of obligations and liquidity that affect acquisition cost.
You use this metric to standardize analysis across firms with different capital structures. It pairs well with EBITDA to compare operating performance regardless of financing or tax differences.
When two firms share similar market capitalization, differing debt or cash positions can make their implied valuations diverge materially.
Begin with the distinct capital claims and liquid holdings that change how a buyer would price a company.
Compute market capitalization by multiplying share price by shares outstanding. This gives the equity portion used in the enterprise value formula.
Add short-term borrowings and long-term debt to capture obligations a buyer must assume. Treat total debt as a clear claim on company assets.
Subtract cash and cash equivalents. Include money market funds, CDs, Treasury bills and marketable securities since they reduce net obligations.
When present, add preferred equity and minority interest to reflect non-common claims. This aligns the numerator with all capital providers.
The simple formula ties these pieces together: EV = Market Capitalization + Total Debt − Cash and Cash Equivalents. Use this calculation to form reliable ratios like EV/EBITDA and compare peers.
Begin with live market quotes and the firm's latest financial statements. This ensures your calculation uses current share price and balance sheet figures for accurate analysis.
Pull the most recent share price and shares outstanding to form market capitalization. Then locate total debt and cash equivalents on the balance sheet.
Compute market capitalization by multiplying share price by shares outstanding. Add short- and long-term total debt to that figure. Subtract cash and cash equivalents to net out liquidity.
Start with market capitalization from price × shares outstanding. Add total debt taken from notes. Subtract cash equivalents to reach final enterprise value.
Anchor valuation to the company’s operating cash drivers, then layer in debt and liquidity. That approach ties total value to the business’s core performance and helps you compare firms with different capital mixes.
EV/EBITDA links the purchase claim to operating earnings. You use this ratio to strip out financing and non-cash charges so companies with different leverage become comparable.
EV/Sales pairs total claims with top-line revenue. It proves useful when earnings are negative or uneven, since revenue provides a stable basis for relative valuation.
Look at the market’s equity estimate and contrast it with a total-claims approach that adds obligations and subtracts liquidity.
Market capitalization shows the market price for equity, measured by share times shares outstanding. It leaves out debt and cash, so a company with heavy borrowings or excess cash can appear misleadingly cheap or expensive.
That omission matters for acquisition planning and cross-company comparison. You must factor in assets and capital structure to avoid a shallow read of market value.
Enterprise measures include debt and subtract cash, so EV-based ratios bring capital providers other than equity into your analysis. P/E ties price to earnings per share and reflects equity return expectations alone.
Match the numerator and denominator: use enterprise with EBITDA or EBIT, and use equity value with net income. That keeps comparisons consistent and reduces misinterpretation across cycles.
When you move between industries, asset intensity often dictates how debt and cash shape overall valuation.
Capital-intensive sectors carry large assets and often finance them with long-term debt. That raises adjusted measures and can make cross-industry comparison misleading.
By contrast, asset-light companies hold less equipment, keep more cash, and show lower adjusted totals relative to peers with heavy capitalization.
Negative enterprise value may appear when cash and equivalents outweigh market capitalization plus debt. That flags unusual balance dynamics and calls for deeper analysis.
Always compare companies within the same industry and at similar business stages. Different capital mixes, interest costs, and refinancing risks skew ratios across sectors.
Build repeatable screens that normalize debt and cash so you compare companies fairly. This gives you a cleaner lens for stock selection and deal checks.
Rank companies by EV/EBITDA or EV/Sales to spot outliers quickly. Those ratios help investors filter the market when earnings differ or margins vary.
Keep a running shortlist where you calculate enterprise value for each candidate. Update price and shares to refresh rankings after major moves.
Start M&A math with enterprise value because it reflects the total cost, adding debt and subtracting cash. That view shows what an acquirer truly pays and whether projected synergies justify the bid.
Factor assets, working capital, and capitalization in your analysis to test sustainable returns. Use enterprise as a bridge between strategy and numbers when you pressure-test deal economics.
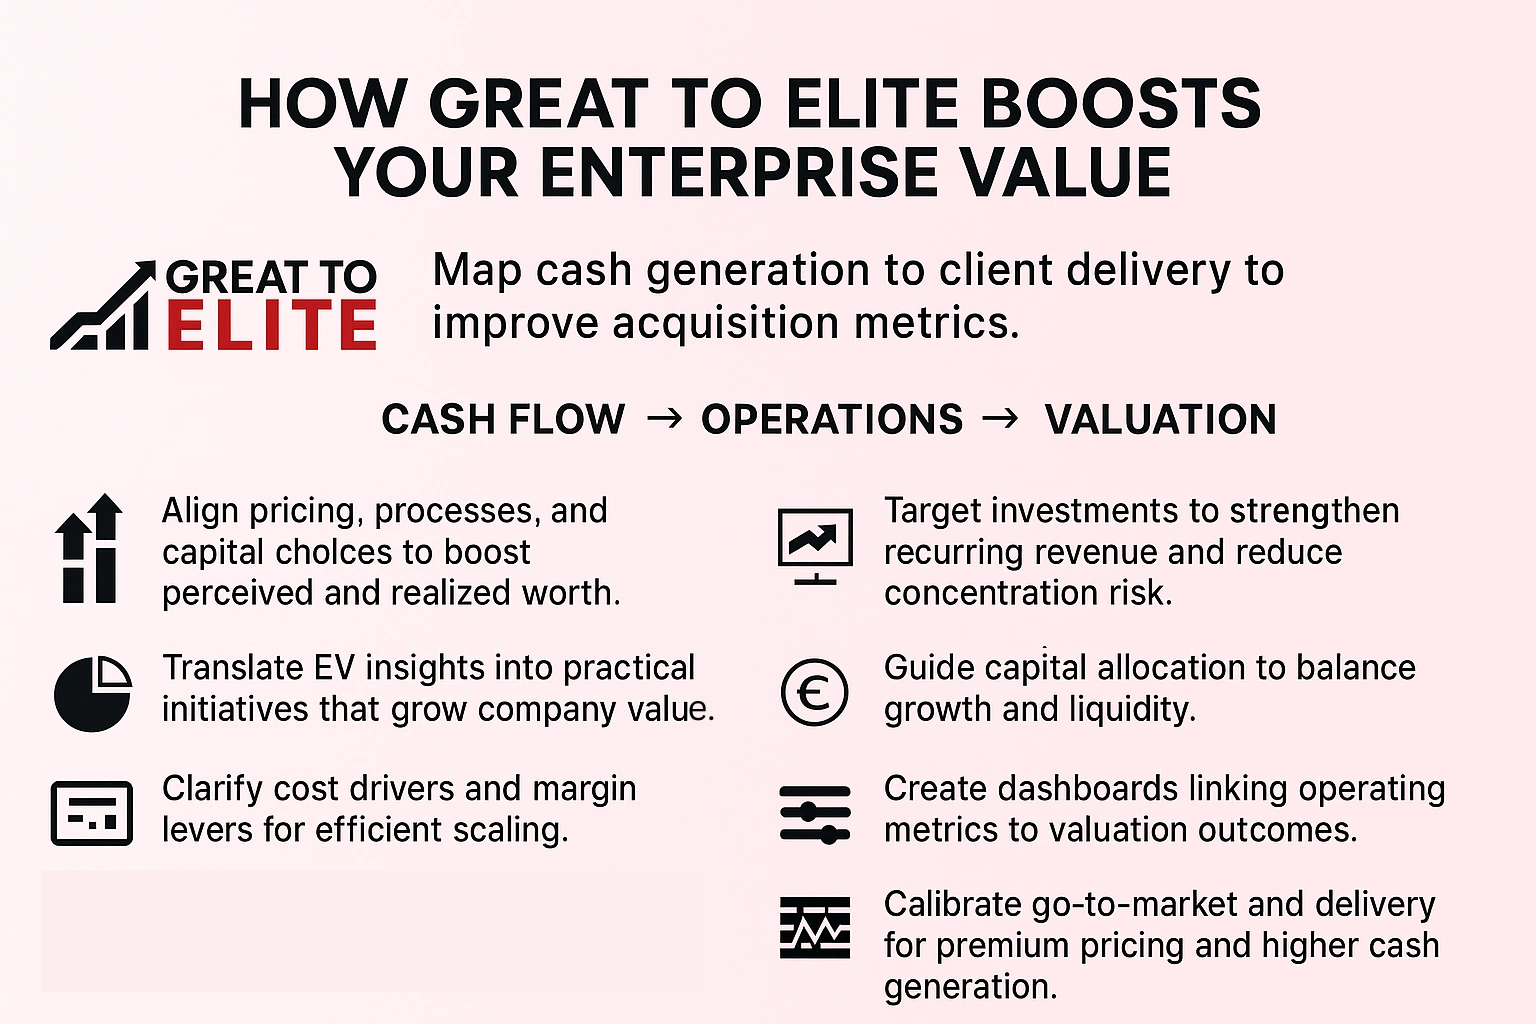
A focused program that maps cash generation to client delivery often moves the needle on a firm's acquisition metrics. For service leaders, aligning pricing, processes, and capital choices can change both perceived and realized worth.
Great to Elite translates big-picture valuation concepts into clear, practical steps for your business.
Start with a short audit. Book a call with Great to Elite to review valuation drivers, prioritize quick wins, and design a plan to unlock measurable gains.
Use enterprise value to combine market capitalization, debt, and cash so your view of a company reflects total value, not just equity. Start every calculation with live price and shares, add debt, and subtract cash and marketable securities from the balance sheet.
Apply EV/EBITDA and EV/Sales to relate operating earnings and sales to valuation, while checking earnings quality and assets. Keep comparisons within industry peers, update inputs often, and pair ratios with qualitative insight.
With this method you can screen stock ideas, assess deals, and explain outcomes to investors using a clear, repeatable framework. Great to Elite can help turn these steps into action.
