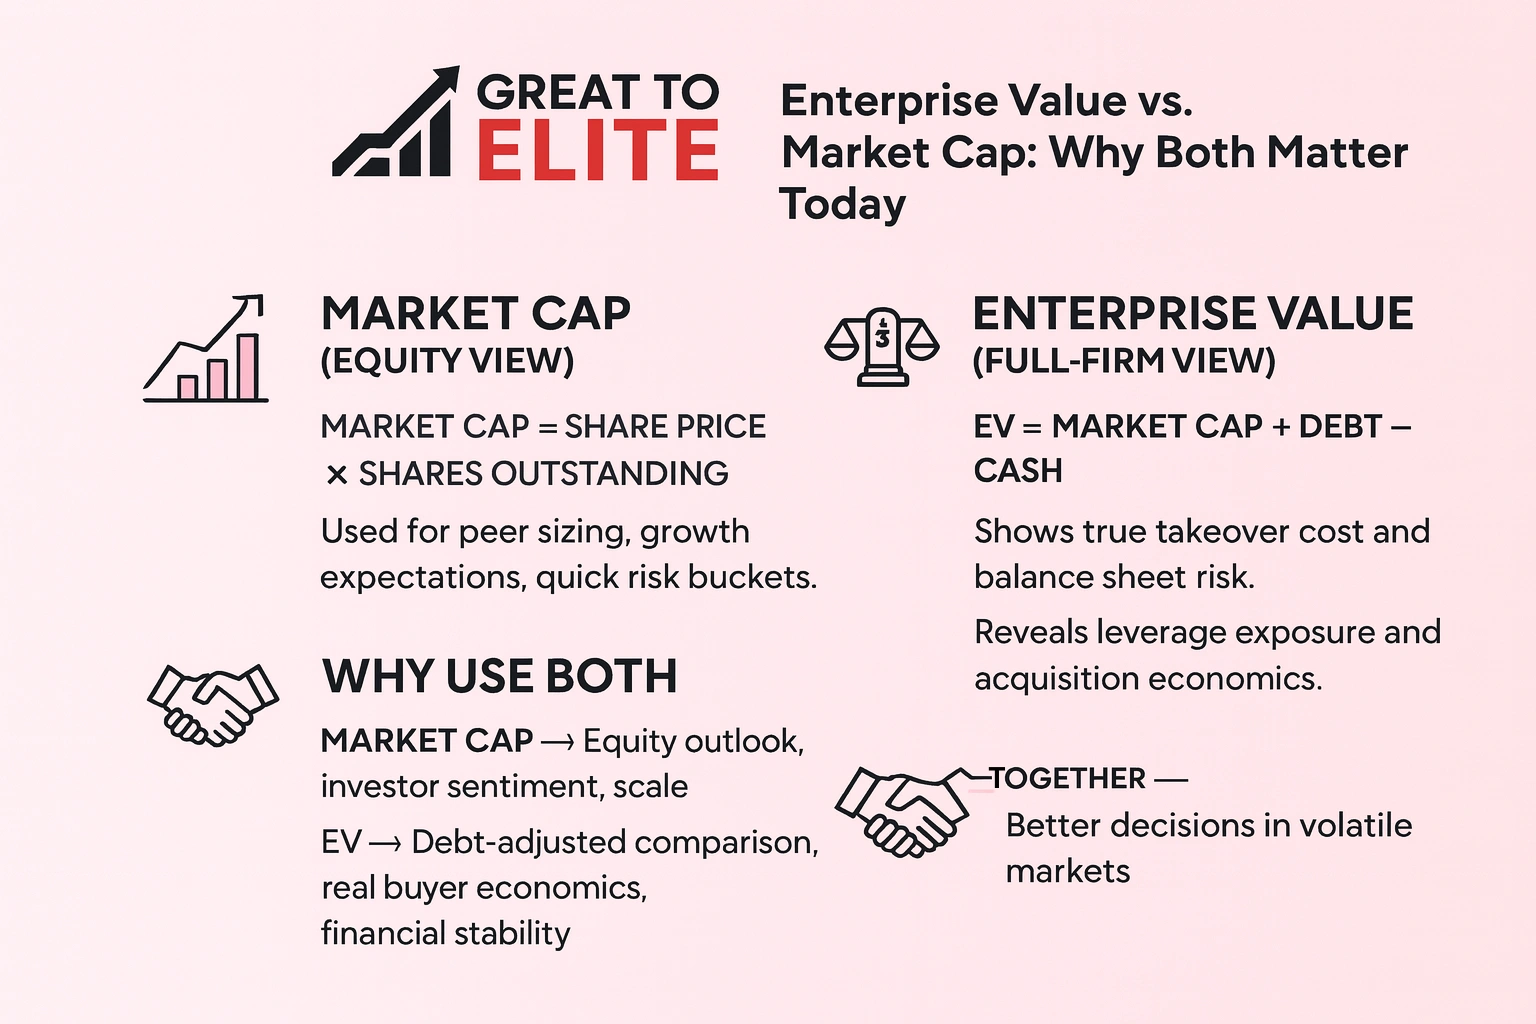
Enterprise value represents the total value of a company’s core operations. It captures what a buyer would effectively pay to acquire the entire business by adding market capitalization and total debt, then subtracting cash and cash equivalents. In other words, it reflects the full economic cost of ownership, since a buyer takes on the company’s debt but also gets access to its cash.
Market capitalization, on the other hand, shows the value of the company’s equity alone. It’s simply the share price multiplied by the number of outstanding shares. This figure tells you what the market believes the company’s equity is worth today, but it doesn’t account for debt, cash, or capital structure.
Key Takeaways
Market capitalization gives a fast size gauge using share price and shares outstanding.
The fuller measure adjusts that figure for debt and cash to capture total worth.
Use both metrics to compare a company to its peers and to spot hidden risks.
Formulas and ratios make the numbers actionable for investment or sale planning.
This guide will walk you from definitions to real use cases and practical checks.
Why Enterprise Value and Market Cap Matter
You are here to compare two commonly used metrics so you can judge how the market prices a company and how balance sheet items alter that picture. These numbers shape quick screening and deeper analysis alike.
Your Search Intent: Comparing Two Core Valuation Metrics
Market cap is the headline number many investors check to size a firm and sort peers by scale. It tells you how the equity market prices outstanding shares at a glance.
Enterprise value adds debt and subtracts cash to estimate what a buyer might pay to take control. That adjustment reveals financing risks and takeover economics that equity-only figures miss.
How These Numbers Influence Investment and Strategic Decisions
Use both numbers together to choose the right lens for your decision. Equity-only measures help with quick risk buckets and growth expectations.
Debt-and-cash-inclusive figures guide decisions about leverage, earnings impact, and acquisition pricing. They matter most in volatile periods when balance sheet strength changes outcomes.
Quick peer sizing and risk buckets with the headline number
Debt-aware comparisons that reveal hidden obligations
Better alignment of selection with your time horizon and tolerance
What Is Market Capitalization?
A simple multiply, current share price times outstanding shares, gives you a company’s market capitalization. This is the most common equity-level measure used to size firms on stock listings. You can verify it quickly when you check a quote page or a filing for the number of outstanding shares.
Definition, Formula, and Where to Find the Data
Market capitalization = current share price × outstanding shares. You will see this figure listed as a key statistic on most trading platforms and in public filings.
Share Price, Outstanding Shares, and the “Size” Signal
The headline number signals company size. A high share price does not always mean a large firm if the share count is low. Always check both inputs to confirm the result.
Large-, Mid-, and Small-Cap: Growth and Risk Profiles
Grouping firms by cap helps set expectations. Larger companies often show steadier revenue and lower volatility. Smaller firms may offer faster growth but carry bigger swings.
Quick check: multiply share price by outstanding shares to confirm the market capitalization.
Use the size buckets to match risk and horizon when you compare firms in an industry.
Remember the limitation: this measure omits debt and cash, so use it with other metrics later.
Metric
Formula
Primary use
Typical signal
Market capitalization
Share price × Outstanding shares
Quick company sizing
Equity market size
Inputs to check
Current price, share count
Verification on listings or filings
True scale and classification
Cap groups
Large / Mid / Small
Risk and growth buckets
Stability vs upside
Limit
Ignores debt & cash
Requires supplemental measures
Partial picture
What Is Enterprise Value?
To know what a buyer actually pays, you look beyond the stock price to include debt and cash on the balance sheet.
Definition, Core Formula, and Why Cash Is Subtracted
Enterprise value = market capitalization + total debt − cash and cash equivalents. This formula approximates the net cost to acquire a company's operations.
Cash is subtracted because excess liquidity reduces the net outlay a buyer would need. In an acquisition, that cash can be used immediately or returned to investors, lowering the effective purchase price.
Variations: Preferred Stock, Minority Interest, and Cash Equivalents
Some calculations also add preferred stock and minority interest to include non-common claims. Likewise, analysts subtract cash equivalents alongside cash for a cleaner, more liquid-adjusted figure.
Why EV Often Reflects a Company’s “True” Total Value
This measure blends equity value and financing claims so you can compare firms with different capital structures. Two companies with the same share-based size can show very different totals once debt and cash are included.
Total debt increases the measure because an acquirer assumes those obligations.
Subtracting cash and equivalents tightens the estimate of net cost.
Adding preferred and minority claims makes comparisons fairer across companies.
Component
Effect on EV
Why it matters
Market capitalization
Plus
Starting equity value
Total debt
Plus
Obligations an acquirer assumes
Cash & equivalents
Minus
Reduces net purchase cost
Enterprise Value vs Market Cap: The Key Differences
Different measures answer different questions. Market cap gives you a quick equity snapshot. Enterprise value adds debt and subtracts cash to show the net cost a buyer would face.
Equity-only perspective
Market cap reflects how the market prices common shareholders’ claim. It’s fast for sizing and screening companies, but it ignores obligations sitting above equity.
Debt-and-cash-inclusive view
Enterprise value layers in company debt and available cash. That makes it a closer proxy for acquisition cost and a clearer lens on capital structure and leverage.
Use market cap for quick peer sizing and sector scans.
Use enterprise value when assessing takeover cost, interest burden, or comparing firms with different financing mixes.
Watch company debt: high obligations can make equity appear cheap while raising real risk and cost for a buyer.
Metric
What it shows
When to use
Market cap
Equity-level size
Screening and quick comparisons
Enterprise value
Net takeover cost (equity + debt − cash)
Deal negotiations and capital-structure analysis
Combined view
Both lenses together
From screening to due diligence
Key Formulas, Components, and Data Sources
Start with simple math and reliable sources so your analysis stays consistent across companies and time.
Market Cap = Share Price × Outstanding Shares
Use this formula to get a quick equity size from live trading data. Check the current share price and the latest outstanding shares figure you can find in public filings or a trading feed.
Enterprise Value = Market Cap + Total Debt − Cash and Cash Equivalents
Apply this to fold in the company’s financing and liquidity. Total debt usually includes short- and long-term borrowings. Subtract cash and equivalents because those holdings lower a buyer’s net outlay.
Where Investors Pull These Numbers
Price and shares come from trading data and exchange records. Debt, cash, and equivalents appear on the balance sheet and in notes to financial statements.
Confirm inputs: reconcile price, share count, and balance-sheet items across filings and data feeds.
Document timestamps: record when you pulled each number for an accurate market value snapshot.
Variant adds: include preferred stock or minority interest when needed to compare companies with different claims.
Input
Source
Why it matters
Share price
Trading feed
Drives current market value
Outstanding shares
Company filing
Scales equity number
Debt & cash
Balance sheet and notes
Adjusts net cost for buyers
When to Use Market Cap vs When to Use Enterprise Value
Pick the metric that matches your decision. If you need a fast size check, use the headline equity figure. If you must judge takeover cost or compare firms with different financing, use the debt-and-cash adjusted measure.
Quick Peer Sizing and Risk Bucketing with Market Cap
Use market cap when you need speed. It helps you slot a company into large-, mid-, or small-size groups fast.
For top-of-funnel screens, this measure gives a directional read on volatility and broad risk. It is ideal when simplicity beats depth.
Comparing Companies Across Capital Structures with EV
Turn to enterprise value when debt and liquidity change the picture. This approach makes comparing companies fair across different financing mixes.
Use it for deeper valuation, acquisition scenarios, or industries that run higher leverage. Keep your peer set consistent so comparing companies yields clear insight.
Initial screens: choose market cap for speed and clarity.
Deeper analysis: choose EV for takeover cost and leverage checks.
Industry norms: favor EV when sector capital use skews comparisons.
Communicate which metric you used to stakeholders to improve transparency.
Use case
Best metric
Why it matters
Fast peer sizing
Market cap
Quickly groups company by size and risk
Leverage-sensitive comparison
Enterprise value
Reflects debt, cash, and takeover cost
Final valuation or deal work
Enterprise value
Better for pricing and capital-structure decisions
Interpreting EV/Market Cap and Common EV Ratios
Look at EV relative to the equity headline to see how leverage and cash shift a company's purchase cost. This ratio gives a quick read on whether total debt or large cash balances are changing the picture you get from the stock price.
Reading the EV/Market Cap Ratio: Debt Load and Risk Signal
When the ratio is high, it often signals heavier debt relative to cash. That points to more balance-sheet pressure and higher interest sensitivity for investors.
When the ratio is low, substantial cash or light borrowing can make equity appear more valuable than a simple price check suggests. Treat extremes as prompts to dig into company debt and cash equivalents.
Value and Cash Flow Lenses: EV/EBIT, EV/EBITDA, EV/Sales, EV/FCF
Use EV-based multiples to compare operational performance across firms with different financing. These ratios normalize for capital structure so comparisons are cleaner.
EV/EBIT ties total cost to operating earnings after depreciation and amortization adjustments.
EV/EBITDA focuses on operating cash before non-cash charges and is common for capital-heavy sectors.
EV/Sales helps when earnings are negative or inconsistent; it values revenue generation.
EV/FCF links total purchase price to actual cash generation available to investors.
Track these ratios over time. Improving margins, faster growth, or deleveraging should lower multiples or justify higher readings. Adjust for one-offs and how cash equivalents are treated in the accounts.
Ratio
Focus
When to use
Key signal
EV/Market Cap
Leverage vs equity headline
Quick balance-sheet screen
High = more debt; Low = more cash
EV/EBITDA
Operating cash proxy
Compare capital-intensive firms
Lower suggests cheaper operational price
EV/FCF
Actual cash generation
When cash flow matters most
Shows sustainability of valuation
EV/Sales
Revenue-based
Early-stage or loss-making firms
Helps assess top-line pricing
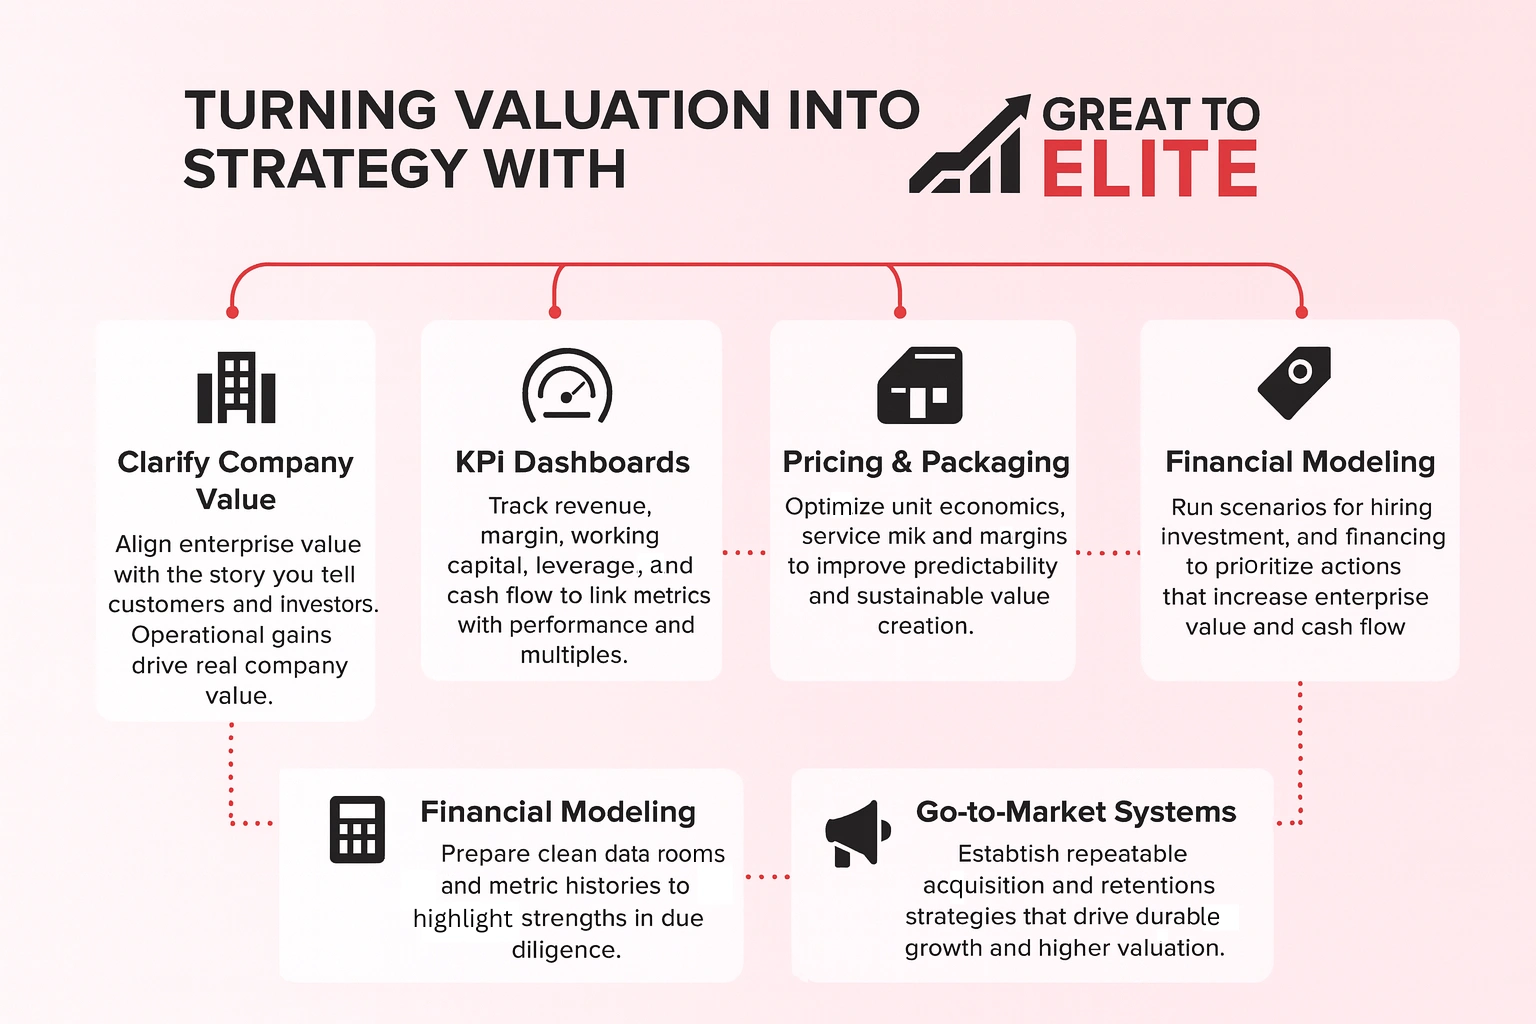
How Great to Elite Helps Businesses Turn Valuation Into Strategy
Move from numbers to action. You can translate the enterprise metrics you've learned into focused steps that grow company value and cash flow. Great to Elite helps you make that translation practical and repeatable.
Practical Support You Can Put to Work
Clarify Company Value: Align your understanding of enterprise worth with the story you tell customers and investors so operational gains reflect in company value.
KPI Dashboards: We build dashboards that track revenue growth, margin, working capital, leverage, and cash flow drivers tied to multiples and performance.
Pricing and Packaging: Optimize unit economics, packaging, and service mix to lift margins and predictability while reinforcing sustainable value creation.
Financial Modeling: Run scenarios for hiring, investment, and financing so you can prioritize moves that boost enterprise metrics and cash flow.
M&A Readiness: Prepare clean data rooms and metric histories so due diligence highlights strengths instead of raising questions.
Go‑To‑Market Systems: Establish repeatable acquisition and retention motions that create durable growth and support higher valuation.
Work With Great to Elite: If you want practical guidance to link analysis to outcomes, book a call with Great to Elite to translate valuation insight into decisive actions that move your business forward.
Conclusion
Use market capitalization as your fast check: the stock price times outstanding shares gives headline size and a simple cap for screening.
Then bring in enterprise value to fold in debt and subtract cash and cash equivalents. That adjusted total shows the likely acquisition cost and how leverage shifts the picture.
Watch extremes: a much higher enterprise value than market cap often signals heavy debt. A low or negative result can mean cash exceeds obligations and warrants deeper review.
Start with market cap, move to enterprise value, layer ratios like EV/EBITDA, and verify price, shares, debt, and cash from filings to make sound calls.
FAQs
What happens to enterprise value if a company issues new shares?
›
When new shares are issued, market capitalization typically increases because the share count rises. Enterprise value may or may not change depending on how the company uses the capital. If the funds add to cash, EV can stay flat or even decrease because the additional cash is subtracted in the EV formula. If the funds are used to pay down debt or invest in operations, EV adjusts accordingly.
Can enterprise value ever be negative?
›
Yes. Enterprise value becomes negative when a company’s cash and cash equivalents exceed the sum of its market capitalization and total debt. This situation is rare and usually signals distressed equity pricing, extremely high cash reserves, or unusual balance-sheet situations that deserve a deeper look.
Why doesn’t market cap show a company’s real acquisition cost?
›
Market cap only reflects what equity holders are worth at current prices. A buyer takes on the entire business, which includes debt obligations but also benefits from available cash. Market cap ignores both, so it cannot represent true takeover cost on its own. That’s why enterprise value is the standard for acquisition analysis.
Does market cap change throughout the day?
›
Market capitalization fluctuates constantly during market hours because its primary input, the share price changes in real time. Enterprise value, by contrast, updates less frequently because debt and cash data typically come from quarterly filings, not minute-by-minute trading.
Why do analysts prefer EV-based multiples over P/E for some industries?
›
P/E focuses solely on equity and can be distorted by leverage, tax effects, or accounting differences. EV-based multiples (EV/EBITDA, EV/EBIT, EV/Sales) compare operational performance to the full cost of the business, making them more reliable for leveraged industries, capital-intensive sectors, or companies with irregular earnings.
Can two companies with identical market caps have very different enterprise values?
›
Yes. Capital structure creates divergence. One company may hold significant cash, reducing its EV well below market cap. Another may have heavy debt, pushing EV far above its equity value. Looking at both metrics side-by-side reveals risk, leverage, and liquidity differences that market cap alone hides.

.webp)