Gross Margin vs Markup: What Is the Difference
Gross Margin vs Markup: What Is the Difference

Natalie Luneva
January 28, 2026


Gross margin and markup are two fundamental pricing and profitability metrics businesses use, but they measure different things.
Gross margin shows what portion of revenue remains after covering the cost of goods sold (COGS); in other words, how much of each sale is profit as a percentage of the selling price. Across all industries, the average gross margin sits around 36.56%.
Markup shows how much a product’s selling price exceeds its cost, expressed as a percentage of the cost. Although both derive from the same numbers (price and cost), markup will always be a higher percentage than the equivalent margin because they use different bases in their formulas.
Mixing up two common percentage measures creates real pricing confusion for teams that quote daily.
Both metrics start from the same dollars: selling price and cost. Still, they answer different questions. One shows profit as a share of cost; the other shows profit as a share of revenue. That simple difference changes the percentage output and the decisions your team makes at the counter or in a quote.
When staff target a generic “25%” without specifying which measure they mean, the outcome is often underpricing that weakens operating margin or overpricing that reduces sales. Small errors repeat across many transactions and quietly lower the quality of revenue even when top-line sales look healthy.
The same profit can produce two different percentages depending on which number you divide by. Each metric answers a different business question and guides different actions.
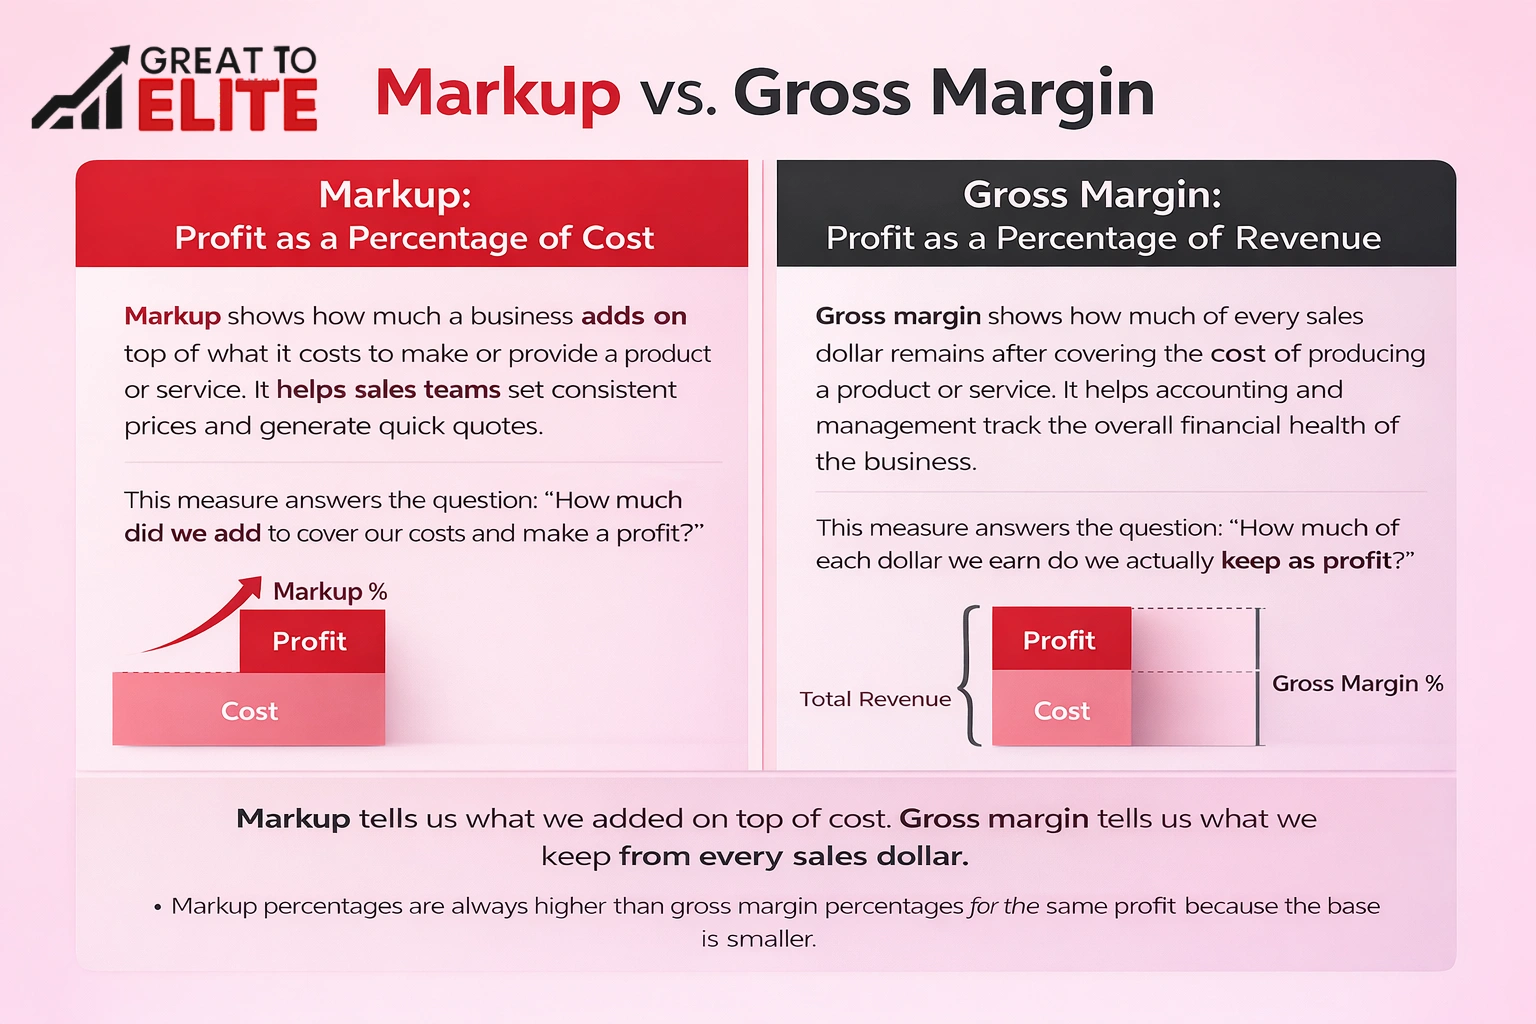
Markup shows profit relative to cost of goods sold (COGS). It answers, “How much did we add on top of cost?” Sales teams use this to set consistent prices and quick quotes.
Margin measures profit as a share of selling price, or revenue. It answers, “How much of each sales dollar do we keep after direct costs?” Accounting and reporting use this to track financial health.
Both metrics can start from the same dollar profit. But when you divide that profit by cost, the percent is higher because cost is smaller than selling price.
That denominator logic means markup will always read larger than margin for the same transaction. Use this rule as a quick sanity check when numbers look odd.
Accurate calculations in the next section require clear definitions for revenue, selling price, COGS, and gross profit.
Before you run numbers, you need clear definitions for the sales terms in each formula. Agreeing on what “sales” and “cost” mean prevents mismatched reports and bad pricing decisions.
Revenue is the total amount received from selling a product or service. In our formulas, "sales" refers to the selling price collected for a single product or contract before subtracting direct costs.
Cost of goods sold are the direct costs required to deliver the product or service. Be consistent about what you include so accounting and pricing line up.
Gross profit is the dollar difference between selling price (revenue) and cost of goods sold. This profit amount is the common numerator in both percentage calculations.
Important: errors in COGS classification or missing cost data will distort profit rates and lead to poor pricing and unreliable financial insight. The numerator stays the same; what changes is the denominator you divide by.
A cost-first approach gives sales teams a reliable path to set prices that protect profit. Below are clear formulas and a simple example you can use immediately to calculate markup percentage and convert it into a selling price.
Markup percentage = (Sales Price − Cost) ÷ Cost.
To set price from a desired rate use: Sales Price = (Cost × Markup %) + Cost. This is the everyday formula many teams use for quick quotes.
Step 1: Profit dollars = $100 × 25% = $25.
Step 2: Sales Price = $100 + $25 = $125.
Quick check: a 25% rate on a $100 cost means $25 profit and a $125 selling price. The next section will compute the other percentage on this same sale to show why 25% on cost is not the same as 25% on sales price.
Measuring profit against revenue gives a clear read on how much of each sale you keep. This percentage is standard on financial statements and helps teams track profitability and efficiency across products.
Formula: (Sales Price − Cost) ÷ Sales Price.
This uses revenue as the denominator, unlike cost-based measures. That difference changes the percentage and the decisions you make about pricing and reporting.
Sales price: $125. Cost: $100. Gross profit dollars = $25.
Margin percentage = $25 ÷ $125 = 20%.
Teams often expect the larger cost-based percent and are surprised by this lower result when they confuse the two measures.
To set price for a target margin use: Sales Price = Cost ÷ (1 − target margin).
“1 − target margin” is the portion of revenue left after profit. Example: $100 cost with a 25% target requires $100 ÷ 0.75 = $133.33 selling price. That implies about a 33.3% cost-based rate, so expect higher quoted rates when using inverse pricing.
Key takeaway: Use the revenue-based formula for reporting and the inverse formula when you need a price to meet a target profit percentage.
A single $30 profit can tell two different stories once you translate it into percentages.
Example: sales price $100 and cost of goods sold $70 produce $30 profit.
The profit percentage against revenue is 30% (30 ÷ 100). The profit percentage against cost is 42.9% (30 ÷ 70).
Operationally, margin describes what the business keeps from revenue. Markup shows how much was added to cost to set price.
Numeric proof: $100 cost with a 25% rate becomes $125 price, which yields a 20% profit margin on sales, not 25%.
Why the gap changes: there is no fixed difference because the denominator shifts with each target. Use these conversions for sales training, pricing guardrails, and quick sanity checks when discounting or negotiating.
Decide which percentage to use based on the decision you need to make: pricing or reporting. Below are clear, actionable rules you can apply when quoting, training teams, or checking financials.
Lead with a cost-based rate when sales need quick, repeatable quotes. If reps can access cost goods sold at the point of sale, apply consistent markups to set selling price and protect profit.
Report using revenue-based percentages in accounting and dashboards. This shows how much of each sales dollar you keep and helps monitor overall profitability and revenue efficiency.

Aligning how teams record direct costs and set selling prices makes pricing repeatable and auditable. That alignment is the foundation for better profit performance and clearer reporting.
Great to Elite clarifies what counts as cost of goods sold and what counts as selling price. Teams get one source of truth for COGS, revenue, and gross profit calculations.
The engagement focuses on clarity, repeatability, and measurable improvement. We document rules, translate profit targets into practical seller-friendly rates, and create simple calculators so sales apply the right formula every time.
Outcomes emphasize cleaner reporting and more confident pricing actions. You should see fewer exceptions, better visibility by product or service line, and faster answers when you calculate profit or set prices.
Great to Elite support can help you:
Next step: Book a call with Great to Elite to review current pricing, cost assumptions, and profit targets. You’ll leave with clear, actionable next steps tailored to your business.
Think of one rate as profit per selling dollar and the other as profit per cost dollar, they tell different stories.
The core difference: margin measures profit as a share of revenue (selling price), while markup measures profit as a share of cost (COGS). The same sale produces two different percentages, so teams must name which metric they mean before setting targets or judging results.
Remember the rule: for the same transaction, markup reads higher than margin because the selling price denominator is larger. Use markup for pricing and quoting, and use margin for reporting business health.
Small mix-ups, like assuming a 25% markup equals a 25% margin, cause ongoing pricing errors and profit leakage. When definitions, formulas, and processes are consistent, pricing becomes faster, clearer, and easier to manage as costs and markets change.
