Operating margin and gross margin are two of the most important profitability ratios for understanding business performance.
Gross margin, which averaged 45.76 % across U.S. companies in Q2 2025, shows how much of each dollar in revenue remains after subtracting direct production costs.
Operating margin goes further, revealing how much profit remains after both direct costs and operating expenses like SG&A, rent, and payroll, but before interest and taxes, offering a clearer view of day‑to‑day operational efficiency.
Key Takeaways
The guide clarifies the difference between the two commonly confused measures.
Each percentage is shown as a share of revenue for easier comparison.
Readers get formulas, cost categorization, and interpretation tips for U.S. firms.
Use these metrics as decision tools for pricing, production, and overhead control.
Industry context matters; the guide prioritizes frameworks over fixed targets.
Profitability Margins That Matter for U.S. Businesses
Profit shares of revenue help underwriters and executives spot trends that raw dollars can hide. In the United States, lenders, analysts, creditors, and leadership teams request these percentages during financing talks, board reviews, and underwriting. Public companies report them quarterly and annually, and private firms use the same math for planning.
Lenders use these ratios to judge risk and stability. Analysts compare a company to peers to see if earnings are durable. Leadership uses the results to decide pricing, staffing, and capital needs.
Where key lines sit on the income statement
Read the statement top to bottom: revenue, cost of goods sold, then gross profit, followed by operating expenses, and finally operating profit (EBIT). Each line feeds the percentage calculations that show how sales convert into profit.
Product-level profit (after direct costs) shows pricing and production health.
Track trends monthly and year-over-year; percentages reveal issues raw sales growth can hide.
Income Statement Line
What It Shows
How It Affects Percentages
Revenue
Total sales for the period
Base for all margin calculations
Cost of Goods Sold
Direct product or service costs
Reduces revenue to product-level profit
Operating Expenses
SG&A, rent, payroll, utilities
Further reduces profit to show operational efficiency
Operating Profit (EBIT)
Core earnings before interest and taxes
Final percentage used for lender and analyst assessment
Gross Margin Explained: What It Measures and What It Includes
Gross profitmargin shows how much revenue remains after you pay the direct costs to deliver a product or service. This tells you what sales contribute to covering overhead and profit, before any other expenses.
Definition: Revenue Left After Cost of Goods Sold
Gross margin is the portion of sales left after paying cost of goods sold (COGS). It isolates product-level performance so you can judge pricing and production efficiency.
What Counts as COGS: Direct Labor, Materials, and Production Costs
COGS typically includes direct labor, raw materials, and production-related costs that scale with output. Some manufacturing overhead fits here if it is directly tied to making goods.
Gross Profit Margin Formula and How to Calculate It
Use this formula: gross profit margin = (Revenue − COGS) ÷ Revenue × 100. Revenue is total sales, COGS are direct costs, and gross profit is the dollar difference. The result is expressed as a percentage.
What a High or Low Gross Margin Can Signal
High percentage: pricing power, efficient production, or a premium product mix.
Low percentage: pricing pressure, rising material costs, waste, or underused capacity.
Use this analysis to decide which products or services to scale, reprice, redesign, or discontinue. Remember: this figure does not include later business expenses, so it can look healthy even when overall profit is weak.
Operating Margin Explained: What It Measures and What It Excludes
Think of this rate as the share of each dollar of sales that stays after product costs and routine business spending, prior to interest and tax charges.
Definition: Profitability of Core Operations Before Interest and Taxes
This measure shows how much profit remains after subtracting direct costs and overhead but before financing and tax items. It uses operating income (EBIT) as the numerator to focus on business performance independent of capital structure.
Typical Overhead Captured
SG&A
Rent and utilities
Payroll and benefits
Insurance and routine admin costs
Formula and Calculation Flow
Follow the sequence: revenue → subtract COGS → gross profit → subtract operating expenses → operating income (EBIT) → divide by revenue × 100.
What This Excludes and Why It Matters
Interest and taxes are left out because they depend on financing choices and jurisdictional rules. Excluding them makes the ratio a cleaner view of day‑to‑day efficiency.
Why this ratio often reveals long-term issues: It highlights discipline in staffing, facilities, marketing, and processes. A business can show strong product-level results yet still underperform here if overhead and costs are unchecked.
Line Item
Included
Why It Matters
Action
Revenue
Total sales
Denominator for the rate
Track by product and channel
Operating Income (EBIT)
Gross profit minus overhead
Shows core earnings before finance and tax
Reduce unnecessary expenses; improve processes
Excluded Items
Interest and taxes
Vary by financing and jurisdiction
Evaluate capital structure separately
Operating Margin vs Gross Margin: Key Differences Side by Side
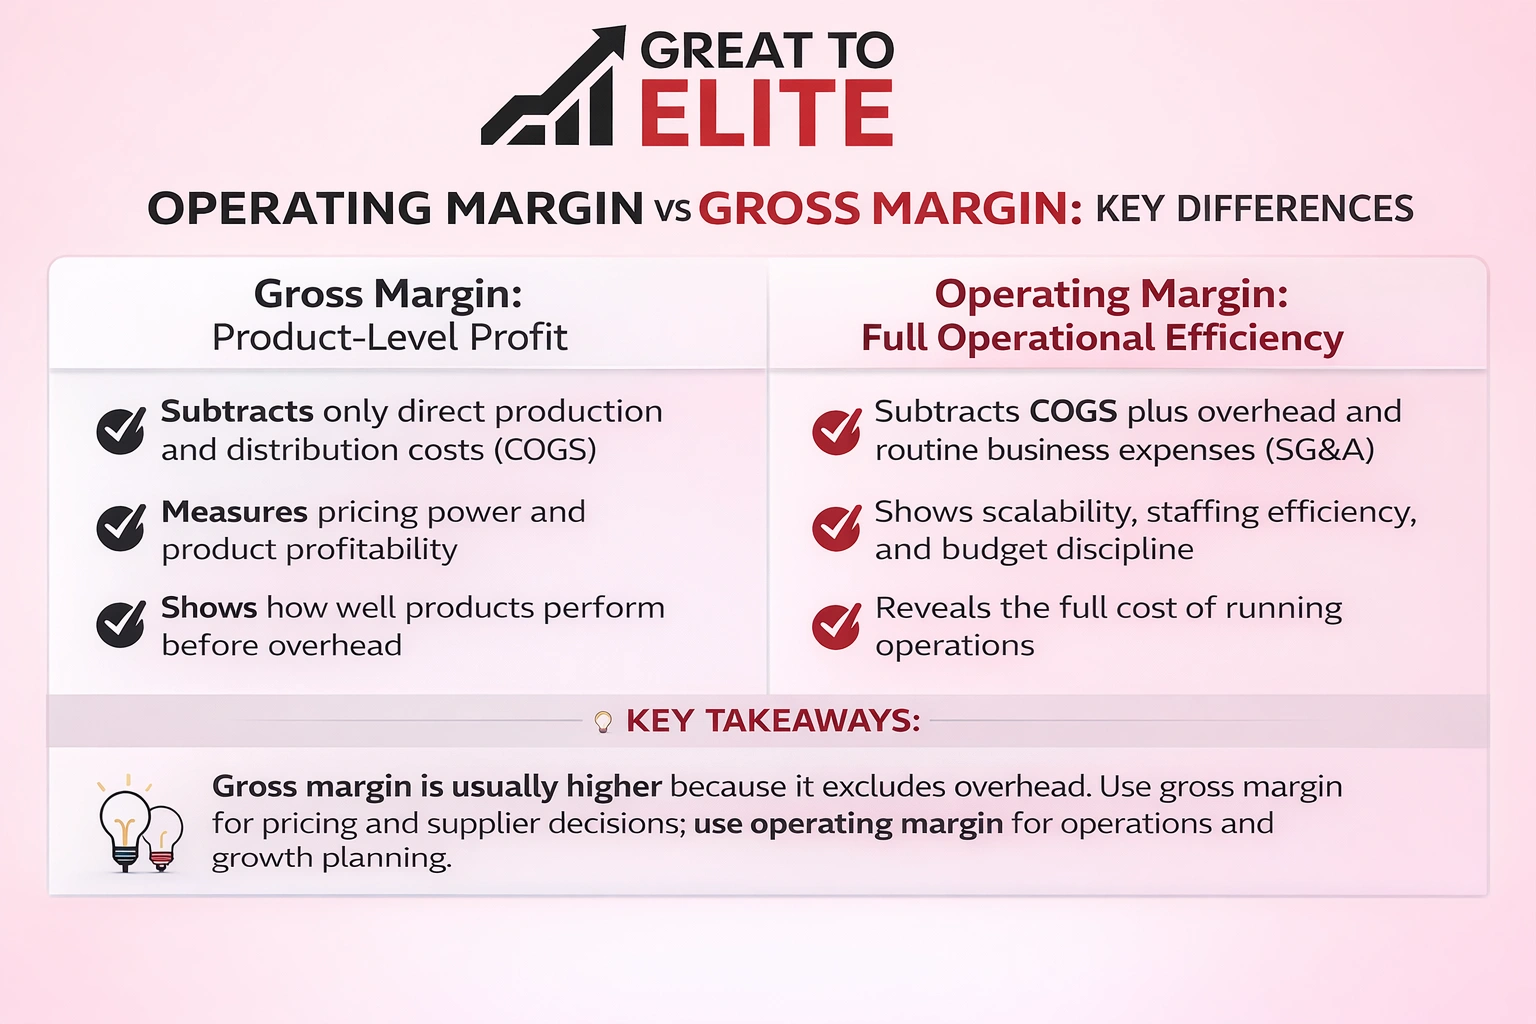
Compare the two ratios by what they subtract: one looks only at direct product costs, while the other also removes overhead and routine business expenses that keep a firm running.
Scope of Costs
Gross margin captures direct production and distribution costs (COGS). It isolates how well pricing and production perform.
Operating margin adds selling, general, and admin expenses to those direct costs. That shows the full cost of running operations.
What Each Metric Shows
Gross margin signals product-level profit and pricing power.
Operating margin reveals operational efficiency, scalability, and budget discipline across departments.
Why One Is Typically Higher
Gross margin is normally higher because fewer costs are subtracted. Adding overhead reduces the percent left from sales.
Interest and Taxes
Interest and taxes sit below operating income on the statement. Excluding them keeps the comparison focused on core performance.
When to Prioritize Each
Use gross margin for pricing, supplier talks, and waste control.
Use operating margin for staffing, process improvement, and growth planning.
How to Interpret the Numbers Using Real-World Examples
Read real numbers the way leaders do: line-by-line and per dollar of sales. Below are short scenarios and worked calculations that show how a healthy product result can vanish after routine overhead.
Healthy product result but weak operating outcome
A company posts a solid gross profit percentage (~36%) yet almost zero operating profit after heavy SG&A. This shows sales and production are fine, but selling and admin costs are consuming results. Leaders must probe marketing, rent, and payroll to find the leak.
Worked gross margin example
Revenue $350,000 minus COGS $150,000 = gross profit $200,000. Gross profit margin = 200,000 ÷ 350,000 = 0.57 (57%). This percentage shows how much of each sale covers overhead and profit.
Worked operating example
Revenue $900,000 − COGS $400,000 = gross profit $500,000. Subtract operating expenses $150,000 → operating profit $350,000. Operating margin = 350,000 ÷ 900,000 = 0.39 (39%). That means $0.39 of every $1.00 in sales remains before interest and taxes.
Benchmark across time and peers in the same U.S. industry; cost structures vary widely.
Price, materials, labor, or rent moves the two percentages differently; use both to diagnose where to act.
Track both metrics monthly so issues appear before cash pressure forces reactive cuts.
Scenario
Key Number
Insight
High product percentage, low operating outcome
36% vs ~0.11%
Fix SG&A and overhead
Worked gross example
57%
Strong product economics
Worked operating example
39%
Healthy core earnings per dollar of sales
Common Mistakes and Practical Ways to Improve Each Margin
Mislabeling direct product costs as overhead, or the reverse, is a common mistake that clouds financial clarity. That error skews profit percentages and sends teams toward the wrong fixes.
To improve margins, review what goes into cost of goods sold and what should sit in operating expenses. When COGS swells with admin costs, product performance looks weak. When direct costs move into overhead, product economics look artificially strong.
Gross improvement levers: tighten pricing discipline, stop discount leakage, renegotiate supplier terms, substitute materials without lowering quality, and cut scrap or waste in production.
Operational levers: staff to demand, lower acquisition costs through smarter marketing, consolidate tools and subscriptions, and use automation to trim manual work.
Protect product profit: improve yield, standardize work, reduce rework and returns, and shift mix toward higher‑margin products or services.
Read both percentages together: if product-level percent falls, fix pricing and COGS. If product-level percent holds but the bottom percent drops, focus on overhead and expense control.
Issue
Action
Expected Impact
COGS misclassified
Reclassify and restate reports
Clearer product profit signals
High selling costs
Improve marketing ROI
Lower operating expenses, higher profit
Production waste
Lean process and supplier changes
Lower costs, better product margins
Quick governance tip: run a monthly review linking metric moves to labor hours, input costs, rent, and marketing performance. Better tracking improves decisions and can strengthen debt capacity when profit rises.
How Great To Elite Helps Improve Profitability and Margin Performance
Many businesses know the formulas; they need help turning those numbers into steady profit improvement. Great to Elite partners with U.S. companies to turn metric signals into operational priorities that leaders can act on.
Structured Ways Great to Elite Supports Your Business
Diagnose drivers: identify what affects gross and operating results so teams focus on pricing, direct costs, or overhead where it matters.
Design plans: convert insights into simple, repeatable workstreams that reduce waste and lower expenses.
Run rhythms: set weekly and monthly reviews so the company tracks progress and holds owners accountable.
Book a Call to Turn Margin Insights Into Action
What you will get:
Great to Elite helps you translate margin metrics into operational priorities, so you know whether to focus first on pricing/COGS, overhead, or sales efficiency.
Great to Elite supports clearer cost and expense visibility so leadership teams can make faster decisions with fewer surprises.
Great to Elite helps build consistent operating rhythms (weekly/monthly reviews) that keep profit targets tied to day-to-day actions.
Great to Elite helps teams align around measurable goals so improvements in gross margin and operating margin show up in real performance.
Book a call with Great to Elite to review your current margin performance, identify the biggest drivers, and leave with a practical, prioritized action plan.
Conclusion
Treat these two profitability ratios as separate lenses: one shows product economics, the other shows how the business runs day to day. Use gross margin to judge pricing and production, and use operating margin to check overhead and departmental efficiency.
If gross profit looks strong but profit after overhead is weak, the problem is likely costs in selling and admin, not the product. Remember that gross margin will usually be higher because it subtracts fewer items from sales.
Next step: calculate both each month, watch trends, and use the gap between them to prioritize fixes. View operating margin vs. gross margin as complementary tools that guide clearer, action‑oriented decisions.
FAQs
Can a business have a strong gross margin but still lose money?
›
Yes. A company can earn healthy product-level profit and still be unprofitable if operating expenses such as payroll, rent, and marketing consume most or all of that gross profit. This is common in fast-growing or poorly controlled businesses where overhead scales faster than revenue.
Which margin do investors and lenders care about more?
›
Lenders and investors usually prioritize operating margin because it reflects the profitability of core operations before financing and taxes. Gross margin matters, but operating margin better signals whether the business model can sustain debt, growth, or distributions.
Do service businesses calculate gross margin differently than product companies?
›
The formula is the same, but what counts as cost of goods sold differs. For service firms, COGS often includes direct labor and subcontractor costs tied to delivering the service. Misclassifying labor is one of the most common errors in service-based margin analysis.
Why does operating margin fluctuate more than gross margin?
›
Operating margin includes overhead, which tends to be fixed or semi-fixed in the short term. Small revenue swings can therefore cause large percentage changes in operating margin, while gross margin is often more stable because direct costs scale with sales.
Is operating margin the same as EBITDA margin?
›
No. Operating margin uses operating income (EBIT), while EBITDA margin adds back depreciation and amortization. EBITDA can overstate operational performance for asset-heavy businesses, so operating margin is often the stricter and more conservative measure.
How should early-stage companies think about these margins?
›
Early-stage companies often accept lower operating margins while investing in growth, but gross margin should still be healthy. Weak gross margins are hard to fix later, while operating margins can improve as revenue scales and overhead efficiency improves.
What margin trends signal a structural business problem?
›
A declining gross margin often signals pricing pressure, rising input costs, or competitive erosion. A stable gross margin paired with a falling operating margin usually points to overhead growth, inefficient hiring, or rising customer acquisition costs.
Should margins be analyzed monthly or quarterly?
›
Monthly tracking is best for internal management because it reveals issues early. Quarterly views are useful for external reporting, but waiting that long can allow cost problems to compound before corrective action is taken.