Gross margin measures what your revenue keeps after covering delivery costs. It isolates delivery efficiency and highlights where costs attach to services you provide.
Profit margin goes further. It shows net income after all expenses so you can see full company performance and overall financial health.
Comparing these percentages over time gives you actionable insights. You learn to spot misclassified costs, avoid misleading industry comparisons, and tie pricing, scoping, and staffing to real results.
Key Takeaways
Profit margin shows net income after all expenses..
Gross margin isolates delivery efficiency; profit reflects total company results.
Tracking margins over time reveals trends and cost classification errors.
Context matters; compare within your industry and delivery model.
Use both metrics with revenue to avoid hidden risks to financial health.
Why Margins and Profit Matter to Your Financial Health
Simple margin metrics reveal whether sales growth truly improves company health. Net profit margin shows how much net income you keep per dollar of sales after operating costs, interest, and taxes. Gross profit margin measures what remains of revenue after cost of goods sold.
For example, Apple reported $59.7 billion in net sales with $37 billion cost of sales in a quarter, producing about a 38% gross margin. The same period gave roughly $11.3 billion net income, an 18.9% net profit margin. That contrast illustrates why the two percentages move differently.
Delivery vs. total results: Gross margin highlights delivery efficiency and focuses on revenue minus cost goods sold.
Watch operating expenses: A healthy gross margin can still yield weak net margin if overhead grows faster than sales.
Use percentage views: Compare margins across periods to normalize for total revenue changes and spot trends.
Industry context matters: Compare to peers in your sector to avoid misleading conclusions.
Track both measures over time so you can tie pricing, staffing, and delivery decisions to clear financial signals. Doing so helps your business turn top-line growth into durable company performance.
Definitions and Formulas You Can Use Today
Start with clear formulas you can use this week. Below you’ll find short definitions, a step-by-step example, and the lines you should draw between direct delivery costs and overhead.
Gross Profit and Cost of Goods Sold (COGS) Explained
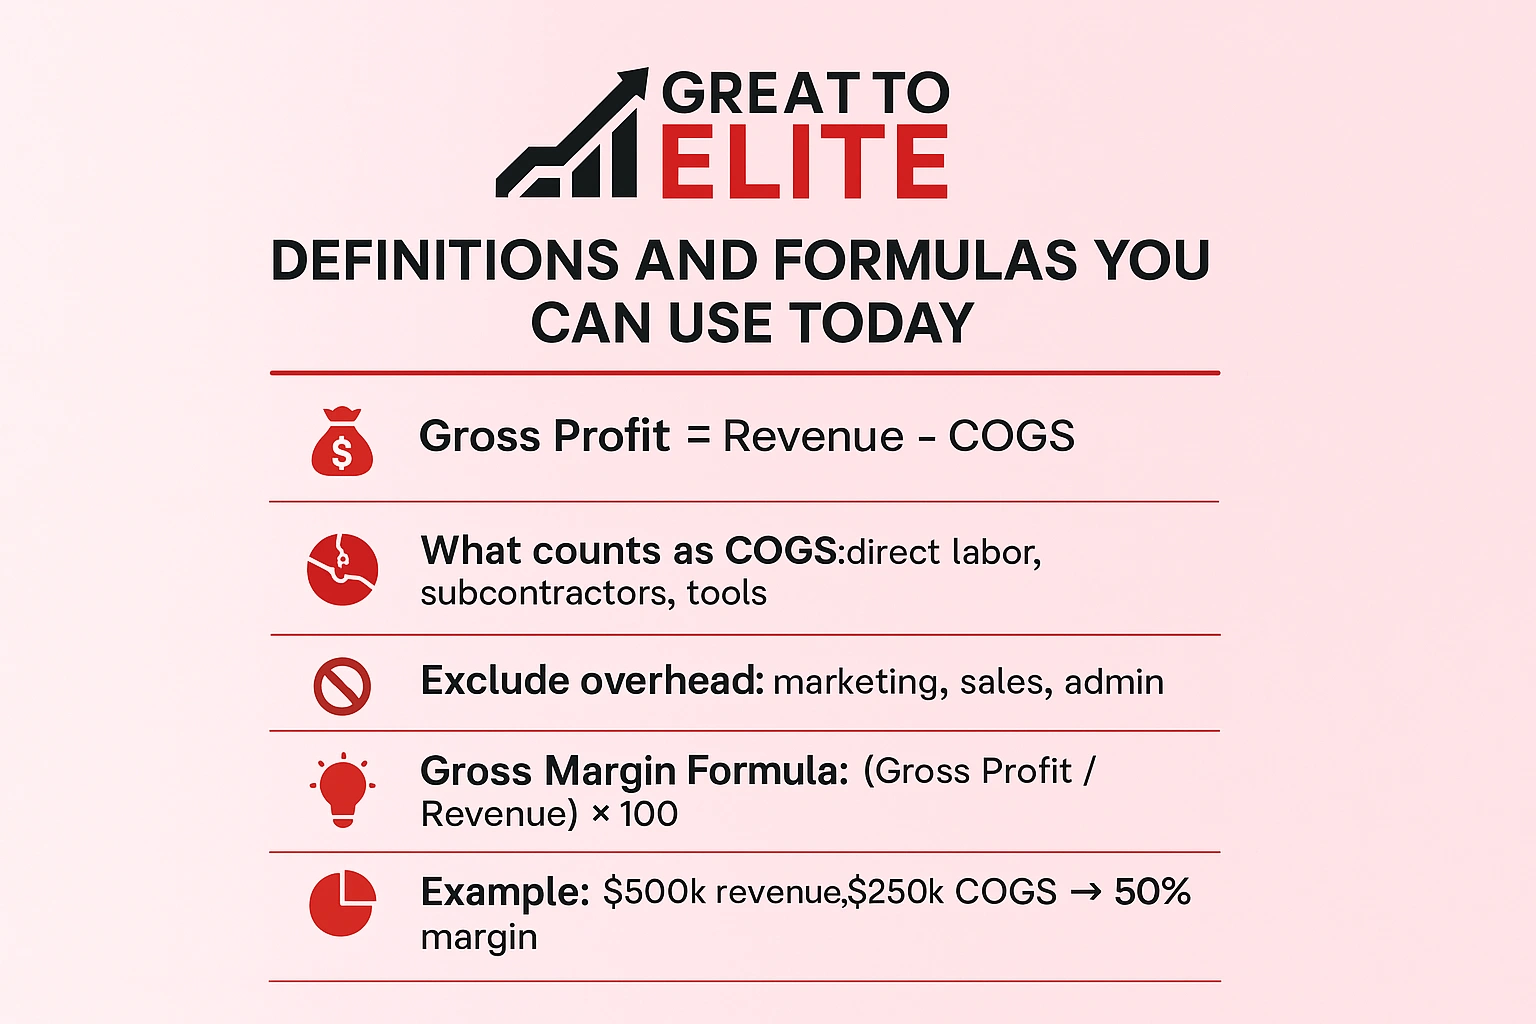
Gross profit equals total revenue minus cost goods sold. For services, include direct labor, subcontractors, and delivery tools in COGS.
Exclude selling, marketing, and general overhead from COGS so the number isolates delivery economics for your services.
Gross Margin Formula and What the Percentage Tells You
To calculate gross margin, divide gross profit by total revenue and multiply by 100 to get a percentage. This percentage shows the share of sales that covers indirect costs and returns to the company.
Formula: (gross profit / total revenue) × 100
Example: $500,000 sales − $250,000 COGS = $250,000 gross profit, which equals a 50% percentage.
Net Profit and Net Profit Margin: The Bottom Line
Net profit margin measures the share of revenue left after operating expenses, interest, and taxes. A strong gross profit margin can exist alongside a weak net profit margin if overhead grows faster than sales.
Keep your accounting rules consistent so your company can track these figures reliably and act on the signals they provide.
Profit vs Gross Margin: Key Differences That Shape Decisions
Knowing which metric reflects delivery and which shows total company results lets you act faster. One highlights direct delivery economics. The other captures the full picture after all costs.
What Each Metric Reveals About Pricing, Costs, and Efficiency
Use gross profit and gross margin to test pricing power and delivery efficiency. These numbers show whether your service pricing covers direct labor, subcontractors, and cost goods.
Net profit and profit margin reveal whether the company turns revenue into earnings after operating costs, interest, and taxes. That helps you judge staffing, facilities, and tools.
Common Mistakes: Mixing Operating Expenses Into Gross Margin
A frequent error is placing operating expenses inside COGS. That inflates direct costs and makes gross margin look worse than it is.
Compare margin vs. profit to spot if discounts or staffing choices are the true cause of a gap.
Standardize cost allocation so teams benchmark reliably across accounts and delivery models.
Prioritize pricing discipline first, then expense management to lock in gains.
Why These Metrics Matter Specifically for Service Businesses
When you sell hours or outcomes, defining direct costs changes how you read results. Services rely on people, subcontractors, and usage-based tools. That means your cost rules must match delivery realities.
Define cost goods sold (COGS) for services as client-billable labor, subcontractor fees, and delivery tools that vary with engagement volume. These are the expenses that scale with sales and should sit inside COGS.
Exclude sales, marketing, administrative salaries, and general software overhead from COGS. Keeping those out preserves an accurate gross profit view for each engagement.
Accurate classification gives clearer gross profit by client, project, and service line.
Products and services have different cost structures, use industry-appropriate benchmarks.
Consistent rules help spot delivery bottlenecks and inform staffing and utilization targets.
Item
Include in COGS
Exclude from COGS
Why it matters
Labor
Billed hours, contractor pay
Sales commissions, admin payroll
Shows delivery cost per engagement
Subcontractors
Project-specific fees
Retainer or recruiting costs
Keeps partner spend tied to revenue
Tools
Usage-based platforms, third-party licenses
Company-wide SaaS subscriptions
Aligns tools to service consumption
How To Calculate, Track, and Interpret Your Margins Over Time
Turn raw revenue figures into step-by-step metrics you can act on each month. A clear sequence keeps results comparable and lets you spot issues early.
Step-by-step: From Revenue to Gross Profit to Net
Record total revenue for the period.
Identify cost goods (COGS) tied to delivery and subtract to calculate gross profit.
Compute gross margin: (gross profit ÷ total revenue) × 100.
Subtract operating expenses, interest, and taxes to reach net profit and the net profit margin.
Dashboards and KPIs
Instrument dashboards that show margin percentage and the dollar amount by client, service line, and project manager.
Track utilization, average bill rate, cost rate, write-offs, and discounts.
Show variance over time so you catch deviations early.
Build a monthly review cadence to trigger root-cause work rather than surprise fixes.
Service Example: Turning Numbers Into Actions
Example math: revenue $500,000; COGS $300,000 → gross profit $200,000 and a 40% gross margin.
With $150,000 operating expenses, net profit is $50,000, a 10% net profit margin. Use that split to focus on pricing, staffing, or scope control.
Metric
Value
What to watch
Action
Revenue
$500,000
Bookings vs. realized sales
Reconcile quotes to actuals
COGS
$300,000
Client-billable labor, subcontractors
Refine cost classification
Operating expenses
$150,000
Overhead growth
Trim non-billable spend
Net result
$50,000
Net profit margin
Adjust pricing or mix
Benchmarks, Trends, and Levers To Improve Profitability
Benchmarking gives you the context to know if a percentage change is normal or a red flag for your business. Use industry data to set realistic targets and avoid misleading cross-sector comparisons.
Industry Context: Why Margins Vary and How To Compare
Different sectors carry different cost structures. Software often posts high percentages (65–70%), while machinery and retail trend lower (30–40%).
That gap explains why a 1% increase in delivery economics had a large impact on operating returns in Deloitte’s retail analysis. Compare like-for-like: delivery model, services or products, and account mix.
Focus on structured pricing and approval rules so discounts require sign-off and you protect both dollar outcomes and percentages.
Move from ad-hoc cost-plus to value or ROI selling for key accounts.
Shift mix toward higher-margin services and prune low-return offerings.
Tighten delivery costs: capacity planning, utilization targets, and contractor rates.
Formalize credit terms and payment discipline to optimize cash flow and company resilience.
Industry
Typical delivery percentage range
What to watch
Software
65–70%
High recurring revenue, watch operating spend
Retail
30–40%
Tight price control and inventory costs
Machinery
30–40%
Scale benefits and service mix lift outcomes
How Great to Elite Helps Service Businesses Boost Margins and Profit
Real gains come from linking what you charge to what it truly costs to deliver each engagement. At Great to Elite, we work with your company to clarify COGS, set pricing guardrails, and measure results so decisions are fast and consistent.
Our approach treats each business line as a testable system. You get repeatable playbooks that protect gross margin and lift net profit margin over time.
Clarity on COGS and Pricing: Precise definitions of direct delivery costs for services, price floors, and playbooks that tie revenue to gross profit.
Margin Visibility: Custom dashboards that show gross margin, profit margin, and net profit margin trends by client, service line, and team, so your company can act in time.
Operational Efficiency: Identify delivery waste, optimize utilization, and align capacity with demand to turn efficiency into higher profit.
Smart Discounting: Approval guardrails and value-based selling playbooks that limit unmanaged discounts at the quote stage.
Offer Mix Strategy: Shift toward higher-return services and accounts, backed by data on segment performance and company profitability.
Cash and Terms Discipline: Tighter billing cadence and credit policies to improve cash conversion and support reinvestment.
Advisory and Enablement: Practical management coaching and execution support to embed new practices into your operating rhythm.
If you want to improve margins and profit predictably, book a call with Great to Elite to assess your current state and design an improvement roadmap tailored to your company and industry.
Conclusion
Bring delivery economics and whole-company earnings into one view. Gross profit and gross margin capture delivery efficiency by isolating revenue less COGS. Profit and profit margin, including net profit, show what remains after all costs and expenses.
Track both metrics over time and benchmark within your industry. That makes trends visible in dollar amounts and percentage points and guards your company profitability against surprises.
Focus on pricing discipline, mix, and tighter delivery controls so gains in delivery percentages flow into net results. Keep COGS classification consistent, it's the foundation of reliable margins and lasting financial health.
Set dashboards, review each month, and adjust offers and operations. Act now to protect margin and profit and to improve outcomes over time.
FAQs
What’s the easiest way for a service business to define COGS without overcomplicating it?
›
Start with a simple rule: if the cost only occurs because you delivered a client engagement, it belongs in COGS. That usually includes billable labor, contractors, and usage-based delivery tools. Everything else sits in operating expenses.
How often should a service company review its gross margin and profit margin?
›
Monthly is the minimum for decision-making, but weekly checks on delivery costs, utilization, and discounts help catch issues before they hit month-end results.
Can gross margin improve while profit margin gets worse?
›
Yes. You can tighten delivery costs and raise gross margin while overhead grows faster than revenue. That disconnect often signals hiring ahead of demand or rising administrative spend.
Should service businesses aim for a specific gross margin percentage?
›
Targets vary by industry, delivery model, and skill mix. Most service firms aim for 45–70%, but the right number depends on how specialized the work is, how billable labor is structured, and your ability to price for value.
Which costs are most commonly misclassified in service businesses?
›
Administrative salaries, internal training time, company-wide SaaS tools, and sales commissions. Misclassifying these into COGS distorts gross margin and hides efficiency issues.
How do retained earnings relate to profit margin?
›
Net profit margin determines how much income you generate. Retained earnings show how much of that income you keep in the business rather than distribute. Strong margins over time build stronger retained earnings, which fund growth, hiring, and resilience.