Enterprise Value for a Private Company Explained
Enterprise Value for a Private Company Explained

Natalie Luneva
January 23, 2026


Enterprise value for a private company is the total cost a buyer would pay to acquire a firm. For privately held firms, the calculation matters for fundraising, buyouts, partner buy-ins, and exit planning.
Valuing a private firm is harder than valuing a public one because disclosure is limited, ownership is illiquid, and comparable deals are fewer. In fact, private companies are often valued at a 13% lower EBITDA multiple on average than comparable public firms due to illiquidity and limited data, making valuation ranges broader and more subjective than point estimates.
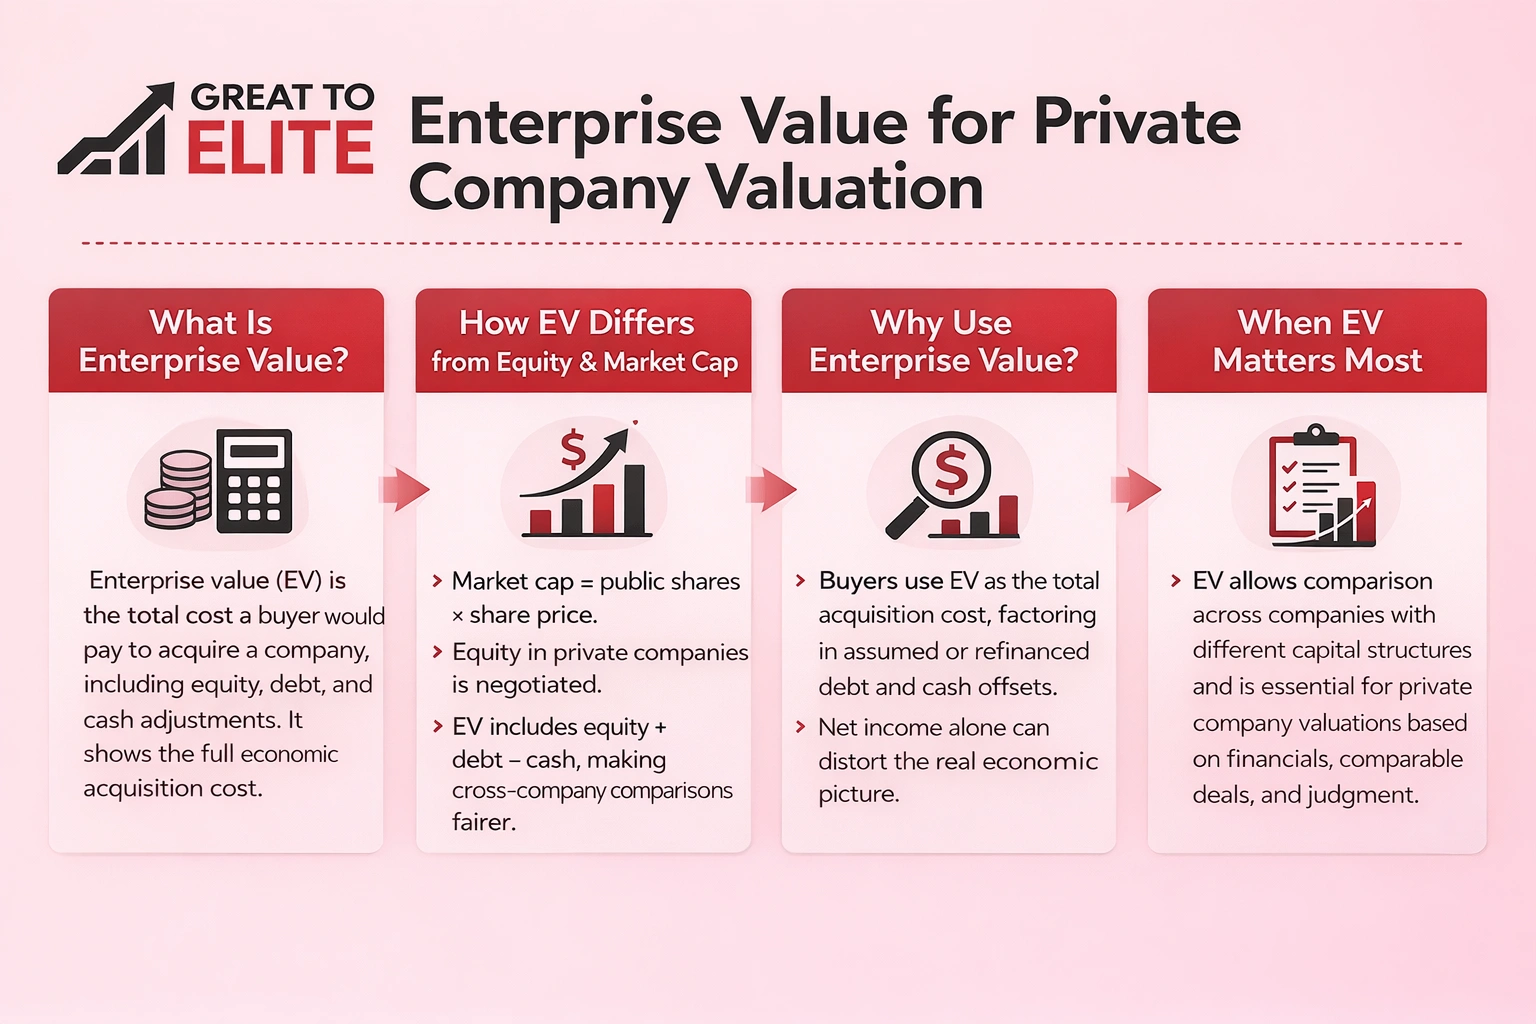
Enterprise value for a private company is the total cost a buyer would pay to acquire the firm, including equity, debt, and cash adjustments. Comparing firms with different debt and cash requires a measure that bundles all claims. That approach gives buyers a clearer view of total acquisition cost rather than a simple ownership number.
Market cap is easy to compute for a public company: shares outstanding times share price. For non-listed firms, equity is a negotiated stake and can vary with terms.
Buyers use a total-cost measure because it combines the buyer's payment for equity with debt assumptions and cash adjustments. This makes cross-firm comparisons fairer.
Acquirers often assume or refinance debt and count cash on the balance sheet as an offset. That means the headline purchase price does not equal the full economic cost.
Net income can be distorted by taxes, depreciation, and one-time items. A cost-based metric removes capital structure differences and accounting quirks.
Using such multiples also lets analysts compare a target to public companies, even when leverage and tax situations differ.
Assessing worth for non-listed firms is tougher because financial transparency is limited and market signals are scarce. Analysts face information gaps, and that raises uncertainty in any company valuation.
Limited disclosure means many private companies supply unaudited statements or high-level summaries. That forces analysts to verify figures, adjust for owner perks, and be conservative with assumptions.
Without a public market, there is no continuous price to test bids and offers. That illiquidity widens the expected bid/ask spread and often leads to a liquidity discount.
Deals rarely publish full terms. Headline multiples can mislead when synergies, earn-outs, or seller financing drive prices. Fewer transactions also reduce statistical confidence in peers.
Practitioners triangulate methods, use ranges rather than single figures, and document assumptions. The hard part is not the math; it is assembling reliable information and turning it into decision‑grade data.
Breaking a firm's claims into clear line items shows what an acquirer actually pays. Below is the practical formula and how each entry changes the buyer’s total-cost view.
Formula: common equity (market or implied) + interest-bearing debt − cash & equivalents + minority interest + preferred equity + other debt-like provisions − value of associates.
Remove non-operating assets, one-off accounting distortions, and items better handled as purchase-price adjustments. Document each adjustment in your accounting schedules.
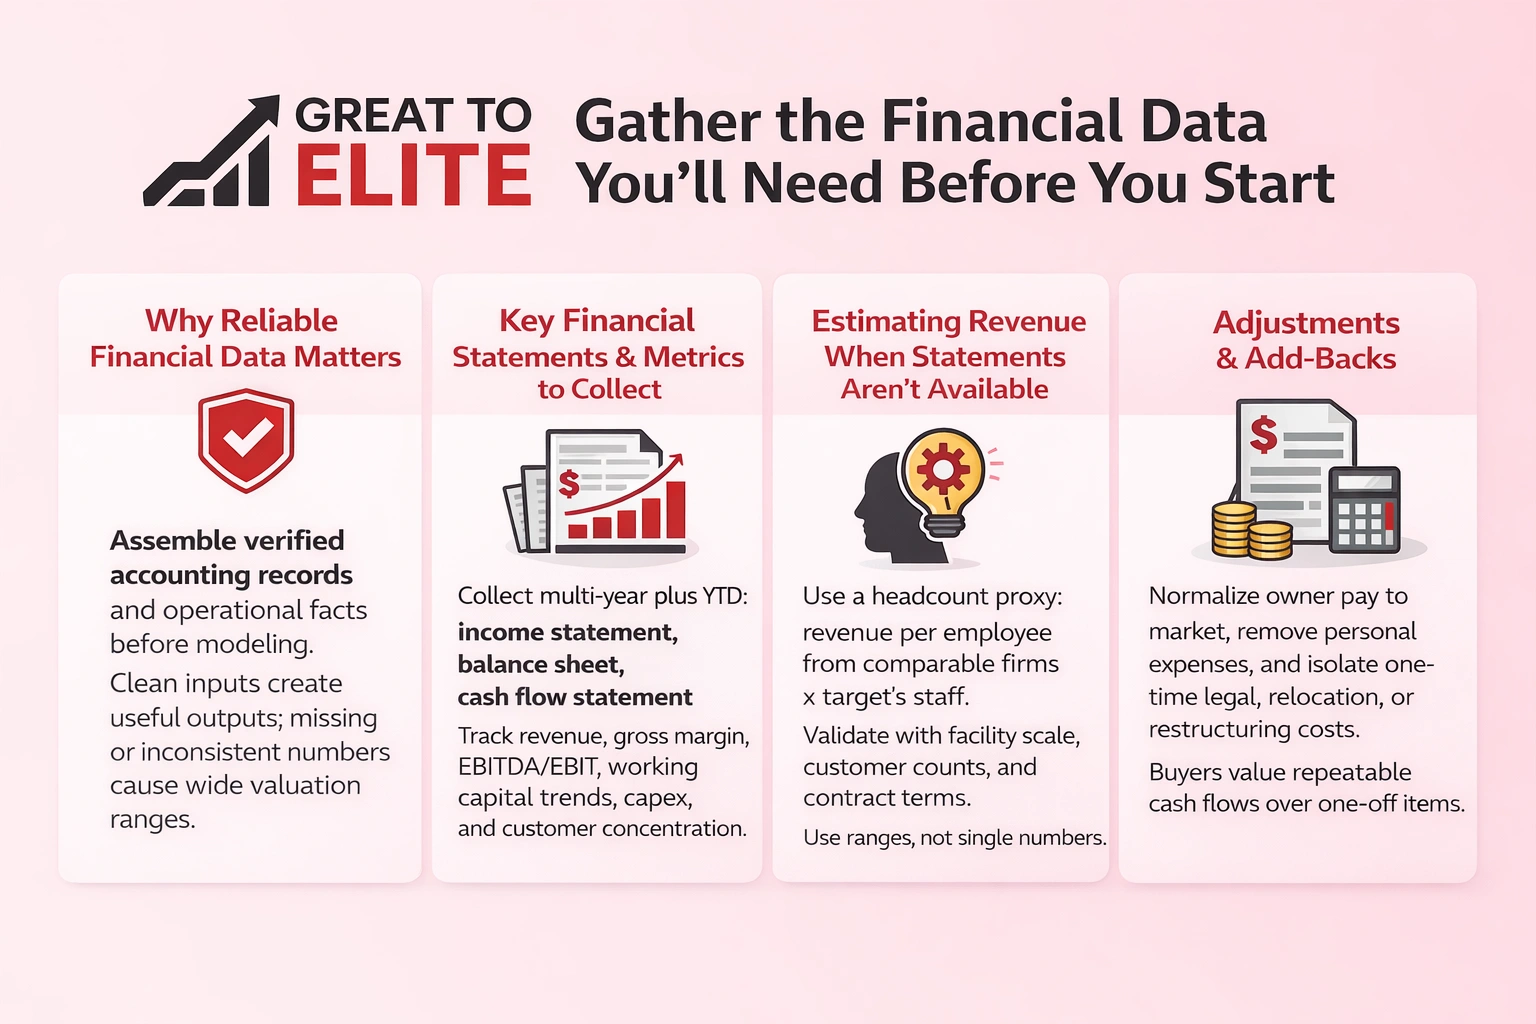
Before you model anything, assemble reliable accounting records and simple operational facts you can verify. Clean inputs make outputs useful. Missing or inconsistent numbers create wide valuation ranges.
Collect these for multiple years plus YTD:
If formal statements are absent, use a headcount proxy. Derive revenue-per-employee ranges from comparable public firms and apply to the target’s staff count.
Validate that estimate with facility scale, customer counts, or contract terms. Always note uncertainty and use ranges, not a single figure.
Normalization checklist: adjust owner pay to market, remove personal expenses run through the business, and isolate one-time legal, relocation, or restructuring items.
These adjustments matter because lenders and buyers value repeatable cash flows and sustainable profitability rather than one-off results.
A defensible comps analysis begins with peers aligned on product mix, scale, and growth rate.
Match industry niche, revenue band, margin profile, and growth. Favor public companies with similar unit economics and go-to-market channels.
Limit the set to 6–12 peers so median multiples are meaningful.
Collect EV/EBITDA and EV/Revenue from recent trades and screens. Compare trailing and forward multiples; forward reflects expected growth and can diverge from trailing if forecasts shift.
Raise the applied multiple for firms with sticky recurring sales or superior margins. Reduce it when capex needs are high or churn is elevated.
Private targets usually warrant a discount for illiquidity and less disclosure. Typical ranges run ~20–40%; report a range, not a single haircut, and justify adjustments in your analysis.
Best practice: start with public companies, then layer adjustments to reach a defensible range.
Precedent transactions reveal what buyers actually paid when control and strategy mattered most. Use them to capture the premium paid for full ownership and deal-specific synergies. Transaction benchmarks often reflect “control” pricing that trading multiples miss.
Sources include SEC filings for larger deals, industry releases, lender memoranda, and advisor decks. These records give concrete multiples and paid prices for similar firms in relevant markets.
Headline purchase price often hides earn-outs, seller notes, and working-capital true-ups. Separate the enterprise measure from financed or contingent payments before applying a multiple.
Strategic buyers may pay more because they expect cost cuts or revenue lifts. That inflates multiples versus what a financial buyer would accept.
Sanity-check deals for auction intensity, distress, financing climate, and timing in broader markets. Blend transaction comps with public comparables and a DCF to triangulate valuations and a defensible cost range.
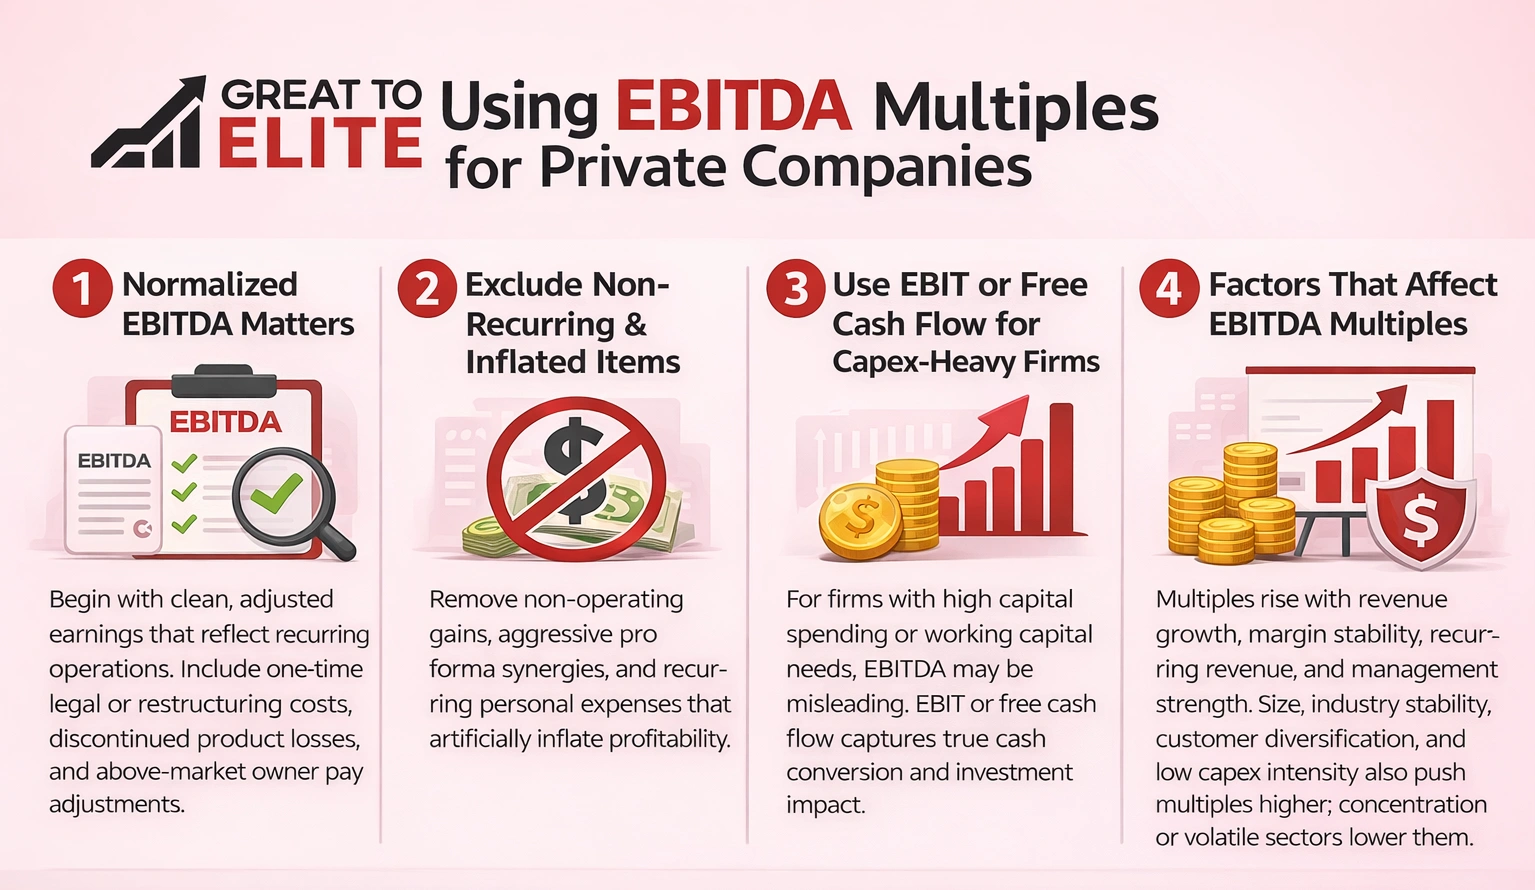
A well‑constructed EBITDA multiple starts with clean, normalized earnings that match how buyers view ongoing profit.
Normalized EBITDA adjusts reported results to reflect recurring operations. Include above‑market owner pay adjustments, one‑time legal or restructuring costs, and discontinued product losses that won’t recur.
Exclude nonoperating gains, aggressive pro forma synergies, and recurring personal expenses that try to inflate profitability.
High capex or heavy working capital needs can make EBITDA misleading. For these firms, use EBIT or free cash flows to capture capital spending and true cash conversion.
Multiples move on clear factors: revenue growth, margin stability, customer diversification, and management depth.
When profits are thin but top-line sales grow fast, pricing by revenue can be the clearest starting point. The formula is simple: EV = revenue × industry multiple. That makes sense when EBITDA is negative or not comparable across peers.
Use revenue multiples for early-stage, fast-growth, or temporarily unprofitable firms where earnings are unstable. They capture scale and market traction before margins settle.
They mislead when revenue is low-quality: heavy discounting, high churn, or transactions that do not repeat. In those cases, top-line scale masks weak economics.
Investors focus on retention rates, gross margin, and customer acquisition efficiency. These metrics show whether revenue converts into durable profit.
Also check revenue mix and recurring revenue. Strong retention and unit economics justify a higher multiple.
Faster growth and a larger addressable market lift the applied multiple. Slowing growth or small scale compresses the multiple and raises execution risk.
Make the approach rigorous: compare to a peer set, adjust for margin profile, and apply discounts for lower liquidity and transparency. Report a range and run sensitivity checks on revenue quality and growth assumptions.
A discounted cash flow model turns forecasts into a present-day estimate, as it prices future free cash flows.
Start with growth rates from similar public peers and adjust for pricing pressure, demand cycles, and U.S. market competition. Use a blended pace: sector peers, historical performance, and realistic penetration assumptions.
Forecast operating costs, tax rates, capex, and working capital separately. Working capital swings often change cash generation more than accounting profit does.
Define free cash flow as EBIT(1−tax) + depreciation − capex − change in working capital. For terminal value, test both a perpetuity-growth approach and an exit-multiple method.
Pick a discount rate that reflects business risk, size, and access to capital. Private targets commonly require a higher rate than public peers to account for illiquidity and execution risk.
Small changes in growth, margins, or the discount rate swing outcomes materially. Present scenarios and a sensitivity analysis so the final valuation is a defensible range.
Risk, control premiums, and macro forces often change what an investor will actually pay. Adjustments are not optional: limited disclosure, illiquidity, and concentration raise required returns for investors and shift pricing.
Use a public-company beta as a starting point to gauge systematic risk, then delever and re-lever for the target's capital structure. Interpret beta cautiously: scale, governance, and visibility differ between public peers and a small target.
Higher interest rates raise the discount rate and compress multiples. Inflation can erode margins and change growth assumptions. Tight credit reduces buyer competition and can lower transaction pricing in the current market.
Always document assumptions so lenders, buyers, and investment committees can trace how key risk factors and market conditions changed the outcome.
A structured process turns incomplete records into a documented, market‑aligned outcome. Great to Elite acts as a practical partner for owners and investors in the United States.
Data gathering and normalization: we create a clear financial data request, reconcile statements, and adjust owner items to produce repeatable results.
Method selection: we apply comps, precedent transactions, and DCF methods and explain why each approach fits the situation.
Deliverables are designed to support negotiation and financing.

Contact us today to start your valuation process and get actionable insights you can trust.
A credible assessment blends documented inputs with multiple methods and honest sensitivity checks.
Frame the whole business via enterprise and equity adjustments, start with clean financials, normalize earnings, and cross‑check with comps, transactions, and a DCF to reach a defendable range.
Triangulate with three methods, public companies, precedent transactions, and DCF, then apply discounts and risk premiums for illiquidity, limited disclosure, and concentration. Watch for inconsistent accounting, unnormalized EBITDA, ignored working capital or capex, and using public multiples without a private discount.
