Revenue vs Profit: A Complete Guide
Revenue vs Profit: A Complete Guide

Natalie Luneva
January 27, 2026


Understanding the difference between revenue and profit is one of the most essential skills for any business owner. Revenue is the total money a company generates from selling its products or services before any expenses are deducted; it sits at the top of the income statement and shows how much business activity is happening.
Profit, on the other hand, is what remains after all costs, taxes, interest, and operating expenses are subtracted from that revenue; it’s the bottom-line measure of whether the business actually keeps money after running operations.
Why this matters in real terms: in 2024, a Federal Reserve survey found that only 46% of U.S. small businesses reported operating at a profit, while 35% operated at a loss, even as many continued to earn revenue.
Strong sales numbers can hide a fragile cash picture if costs climb faster than orders. Measuring sales activity is not the same as measuring real earnings after expenses. That gap determines whether a business can pay for cost of goods, operating bills, interest, and taxes.
Rising sales can coexist with shrinking margins. Discounts, higher cost of goods, and rising operating expenses or interest all shrink what the business keeps.
Owners watch sales for traction and market demand. Investors and lenders look for consistent earnings, coverage, and cash flow that show sustainability.
Common errors include hiring or expanding too fast, adding channels before margins are proven, or cutting price without tracking net revenue quality. Busy businesses can still be fragile if costs grow faster than sales.
Warning signs: sales up but profit down; ARPU falling from discounts; operating costs rising faster than sales.
.webp)
High sales totals can hide how much cash a business actually keeps each month. In plain terms, revenue is the total income from selling goods or services before expenses. On an income statement it appears as the top line, and every other line steps down from it.
The top line shows the full amount booked from sales and service work. It signals demand and scale, but not what the company retains after concessions or costs.
Total revenue is the broad umbrella. Net revenue (or net sales) subtracts discounts, returns, and allowances. High discounts can inflate gross optics while net sales reveal the true realized amount.
Operating income comes from core business activity. Non-operating income includes one-time gains or investment receipts. Mixing them can distort trend analysis for companies tracking core performance.
ARPU, MRR, and ARR help teams move beyond a single sales total. Use ARPU to test pricing and package mix for each customer.
Use MRR and ARR for subscription predictability, churn insight, and forecasting. These metrics support planning when recurring models matter.
Key point: revenue measures inflow, not what is kept; this prepares you to study earnings next.
Knowing what you actually keep after costs separates good sales from sustainable business health. Profit is the bottom line result after all expenses are subtracted from revenue. In other words, revenue shows what you collect; profit shows what you keep.
Gross profit equals net sales minus cost of goods sold (COGS). COGS are the direct expenses to make or deliver a product or service, materials, direct labor, and production supplies.
Why it matters: gross profit is an early checkpoint. Higher gross profit suggests better pricing or lower cost goods and signals if your core offering is economically viable.
Operating profit (EBIT) subtracts operating expenses from gross profit. Operating expenses include rent, payroll, marketing, utilities, and admin costs.
EBIT isolates core operations before interest and taxes. Improving operating profit generally means stronger operating leverage and improved efficiency.
Net profit comes after interest and taxes. These items can swing final results even when operating performance looks solid, especially with high debt or shifting rates.
Profit before tax (PBT) removes tax effects so owners can compare operating performance across periods and jurisdictions. Use PBT to separate operational change from tax strategy.
A steady stream of orders can hide how much money actually stays in your business. The income statement lays out each step from sales at the top line down to net earnings at the bottom. Understanding each line helps owners spot where cash slips away.
Start with sales (the top line). Subtract returns, discounts, and allowances to reach net revenue.
Next, subtract cost goods (COGS) to get gross margin. Then subtract operating expenses to arrive at operating profit or EBIT.
Finally, deduct interest and taxes to reach net earnings; the bottom line that shows what remains for owners and reinvestment.
Cost goods include direct material, production labor, and shipping tied to making the product. These affect gross margins directly.
Operating expenses cover rent, marketing, admin, and support teams. They drive operating efficiency and cash burn.
Misclassifying costs between these buckets distorts margins and can lead to bad pricing or staffing choices.
Start with clear math: count units sold, multiply by price, and add any extra sales in the same time window. Use monthly, quarterly, or annual consistently so numbers compare correctly.
Formula: (number of sales × price per unit) + other sales.
Example: 650 nights × $120 + $22,000 (food & events) = $100,000 gross revenue.
Formula: gross revenue − discounts − refunds/returns.
Example: $100,000 − $3,000 discounts/refunds = $97,000 net revenue. This is the better baseline for earnings math.
MRR = subscription price × subscribers. ARR = MRR × 12.
ARPU = net revenue ÷ total units (customers or nights). Example ARPU: $97,000 ÷ 650 = $149.23.
Note: interpret ARPU with discount and churn context; higher ARPU may hide heavy discounts.
Calculating what a business keeps requires stepping through each cost layer to see the real outcome. Each layer answers a different question: delivery economics, operational discipline, and total business sustainability.
Formula: Gross profit = Net revenue − COGS (cost of goods sold). COGS are the direct costs tied to producing or delivering your product, materials, direct labor, and production supplies.
Example: Net revenue = $97,000; COGS (650×$30) = $19,500. Gross profit = $77,500. Use this step to test whether your offering can cover direct costs.
Operating profit (often called EBIT) is gross profit reduced by operating expenses like rent, salaries, marketing, and admin.
With gross profit of $77,500 and operating expenses of $45,000, operating profit is $32,500. This line shows how well you control overhead and run daily operations.
Net profit subtracts interest and taxes from operating profit. Debt and tax strategy can swing this final figure substantially.
In the example above, $32,500 is before interest and taxes. After interest and taxes, the final retained amount may be much lower depending on rates and debt.
Next: we examine what moves sales and what moves margins in today’s market so you can pick the right levers.
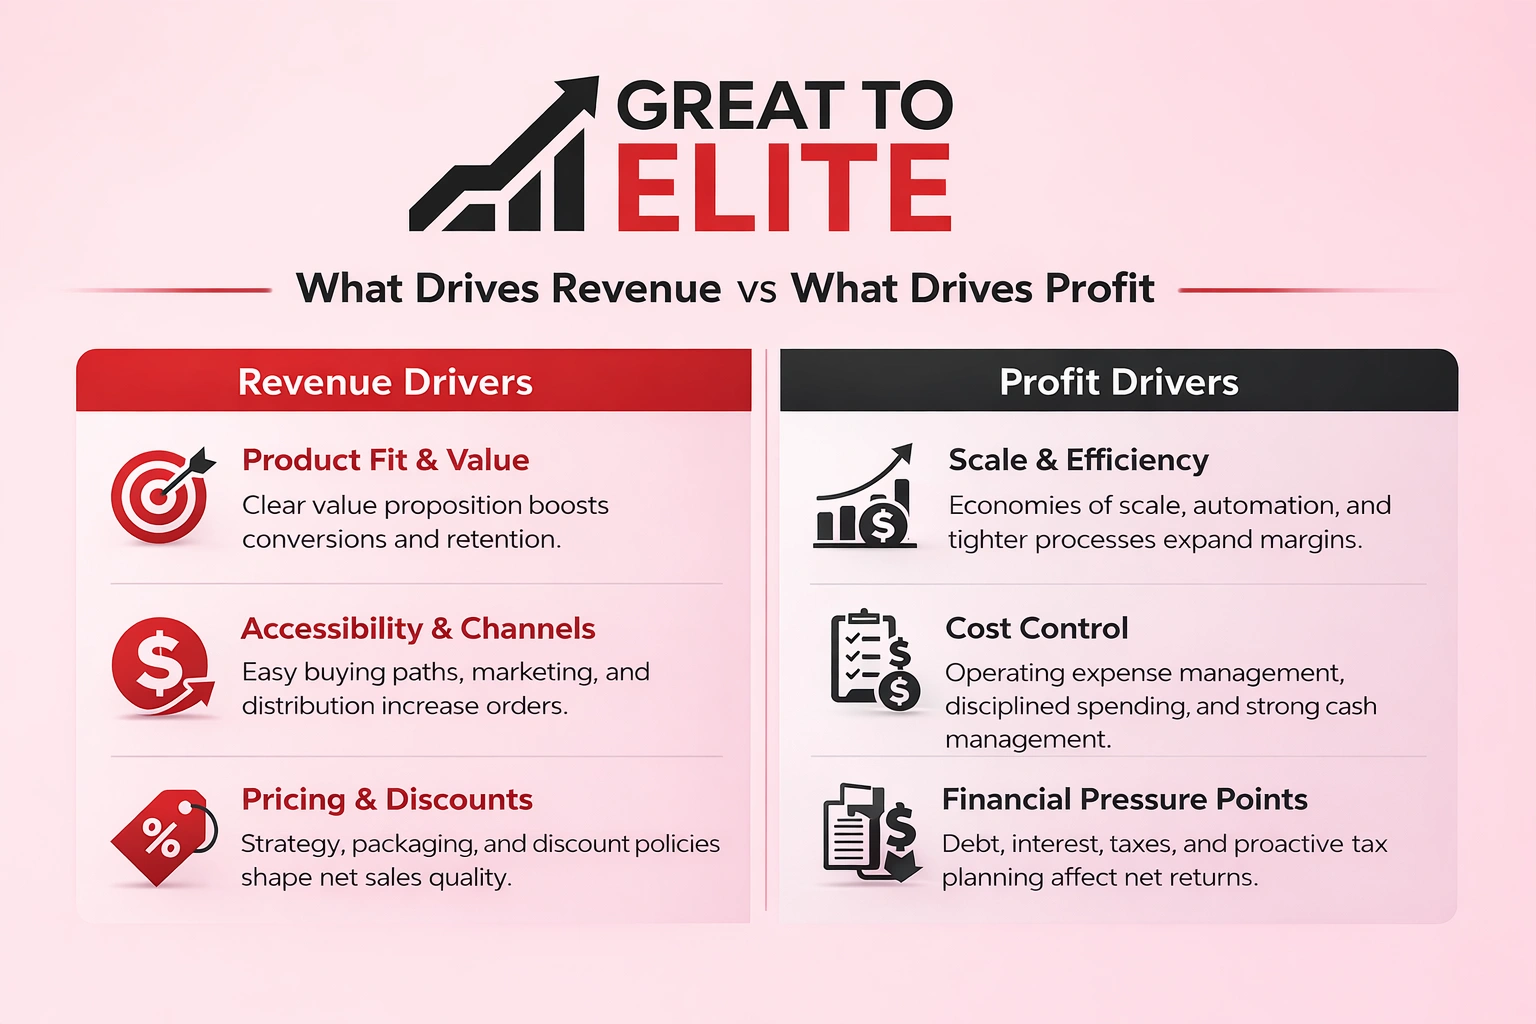
A practical map of levers and pressures helps leaders act where they can and monitor what they must adapt to. Below are the main drivers you can influence and the pressure points that need constant attention in a US business.
Product-market fit and a clear value proposition lift conversions and improve retention. Competitive differentiation and easy buying paths increase order frequency and lifetime value.
Pricing strategy, packaging, and discount policy shape net sales quality, not just totals. Marketing, channel access, and customer experience drive demand shifts that change realized income.
Economies of scale, automation, and tighter processes expand margins. Disciplined cost control and strong cash management turn higher gross margins into sustainable after-tax results.
High debt and rising interest compress bottom-line returns quickly. Proactive tax planning and refinancing reduce after-tax drag without raising sales.
Inflation, demand shocks, and regulatory change can reduce demand or increase costs. Build contingency plans and stress-test forecasts to stay resilient.
Smart leaders use the income statement to choose between expansion and efficiency. Use simple rules: when you need traction, emphasize total revenue and net revenue. When you need sustainability, focus on gross profit, operating profit, and net profit.
Track top-line trends and recurring metrics (MRR/ARR) to plan capacity. For a subscription company, MRR growth signals onboarding needs and customer-support hiring.
Use those trends for inventory buys, workforce planning, and realistic quarterly targets so growth doesn't outpace operations.
Net profit determines what the company can fund after operating expenses, interest, and taxes. Base hiring and capital projects on what remains, not on sales forecasts alone.
This keeps payroll and reinvestment within sustainable limits and protects cash.
Watch for these drivers of divergence:
Case 1: A retailer posts big sales but loses money because heavy promotions and expensive supply chains push costs above income.
Case 2: A niche service firm has modest sales but strong net profit thanks to tight cost control and efficient delivery.
Adopt a weekly/monthly rhythm: review total revenue, gross margin, operating expenses, operating profit, and net profit from the income statement. That cadence helps spot trends early.
Great to Elite builds clear plans that grow sales while protecting margins. Typical outcomes include:
If you want a clearer plan to grow sales and protect the bottom line, book a call with Great to Elite today!
Think of the income statement as a simple flow: top-line revenue, minus COGS and operating expenses, then interest and taxes, ending with net earnings. That step-down shows where money leaves and where margins tighten.
Use revenue to track demand and traction. Use profit to make hiring, budgeting, and reinvestment decisions that protect cash and long-term viability.
Watch for divergence, sales up but margins down, and act on pricing, discounts, COGS, overhead, or financing. The healthiest businesses treat revenue vs profit as a system, balancing growth with profitability to preserve financial health.
