Profit Forecast for Service Businesses
Profit Forecast for Service Businesses

Natalie Luneva
November 19, 2025


A profit forecast is a data-driven projection of the profits your business expects to make over a specific period, factoring in anticipated revenues, variable and fixed costs, and operational trends. For service businesses, a profit forecast shows which services drive true profitability, where margin leaks occur, and how changes in staffing, pricing, or client demand can impact the bottom line. With a reliable forecast, business leaders can make informed decisions: whether to take on a new client, invest in team expansion, or adjust pricing for underperforming services. In short, profit forecasting turns uncertainty into clarity, giving service businesses the insight to plan confidently, manage cash flow, and grow sustainably.
A disciplined projection turns past patterns and current signals into a clear picture of expected net results. This view helps leaders plan for the next quarter or year and set measurable goals.
Define this process as a structured projection built from historical data, market indicators, and explicit assumptions. It estimates net results for a set time and guides planning decisions.
In uncertain markets, forecasting converts scattered information into one actionable view of expected performance. Teams use it to test pricing, adjust staffing, and spot cash shortfalls early.
A clear comparison helps teams see why sales targets alone do not guarantee healthy net returns.
A revenue forecast estimates gross sales over a period and uses past sales, market signals, and delivery capacity. It focuses on volume, pricing, and channels so marketing and sales can set targets.
A profit forecast combines those sales with fulfillment cost, operating expenses, taxes, and non-operating items to estimate net results. This view shows whether revenues create real value for the company.
Use the revenue view to plan campaigns, staffing, and capacity. Use the profit view to decide budgets, hiring, and capital projects.
For example, rapid sales growth might need extra facilities or staff. Those added expenses can reduce net results even as sales rise. That is why leaders cannot rely on sales alone.
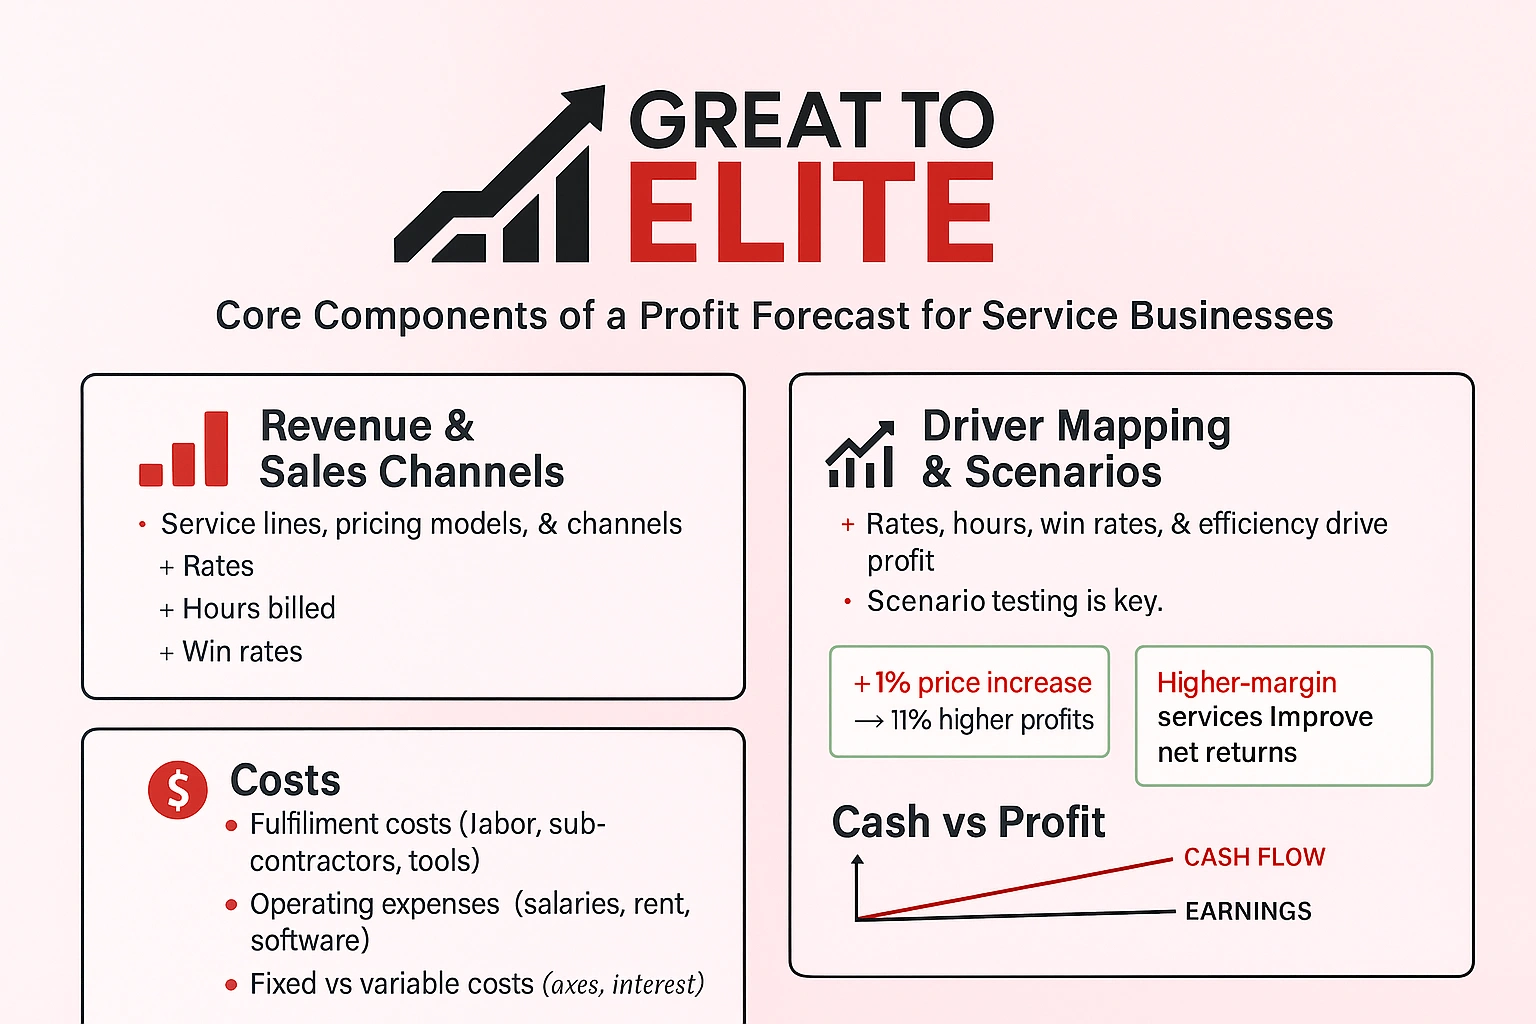
A useful model breaks income by service line, ties each line to delivery costs, and layers operating and non-operating items to reveal net results.
Break revenue into service lines, pricing models, and channels. Channel-level views cut aggregation bias and show where demand shifts.
Analyze rates, hours billed, and win rates for each channel so the company can test scenarios by mix rather than only by total sales.
List direct fulfillment costs: delivery labor, subcontractors, tools, travel, and any variable fees. Changes in utilization and project scope drive these costs up or down. A 1% increase in pricing can generate an 11% increase in operating profits for professional service firms.
Record operating expenses, salaries for non-billable roles, rent, software, and utilities, and mark which are fixed versus variable to improve monthly performance checks.
Include expected taxes by jurisdiction and non-operating items like interest income or expense so the model ties to comprehensive results.
Example: A shift to higher-margin services can raise net returns even when top-line revenue grows modestly.
Assemble clean historical records so patterns in sales, seasonality, and utilization appear clearly. Use those records to pick a time frame, typically a year with monthly and quarterly breakouts, to capture cycles and utilization shifts.
Pull accurate financials, hours billed, win rates, and customer counts. Reconcile revenue by channel so data feeds the model reliably.
List the drivers: average rate, hours per engagement, win and retention rates, and upsell. Write assumptions plainly so teams can update them when reality changes.
Layer market signals, demand indicators, pricing moves, capacity limits, onto internal drivers. This makes sales projections realistic rather than aspirational.
Link delivery hours to rate cards and scope. Account for subcontractor mix, travel, and materials so variable expenses move with work volume.
Tag each operating line as fixed or variable. Note step-costs such as new hires or office leases that trigger when growth passes thresholds.
Add interest, one-time items, and tax estimates so results reflect full company performance, not just operations.
Example: A modest rise in utilization plus clearer marketing focus can raise sales and net results without adding headcount, test this in your scenarios.
Use a mix of statistical techniques and front-line insight to turn scattered signals into consistent guidance for the next quarter. Good practice pairs simple baselines with targeted models so teams act quickly without overfitting to noise.
Straight-line trends give a clear baseline when growth is steady or data is sparse.
Time-series methods and weighted moving averages smooth month-to-month noise and tighten short-term forecasting for management reviews.
Regression links revenue and sales to drivers like advertising or capacity, making projections reflect how the business actually works.
Executives, sellers, customers, and outside experts supply context where historical data is thin. Use structured inputs, surveys, sales checkpoints, and expert reviews, to keep subjective views measurable.
Tools range from spreadsheets to dashboards that centralize data, automate updates, and track variances.
Good models pair external signals with clear trigger rules so leadership can act before small changes become big problems.
Identify the factors that move demand: seasonality, macro shifts, and industry trends. Translate these signals into specific changes in sales and cost assumptions.
For example, lower consumer confidence may cut bookings by a percentage; seasonality should adjust hours and staffing monthly rather than assuming a straight line.
Build best, likely, and worst scenarios and predefine the decisions tied to each. Set trigger points so teams act fast when markets change.
Use sensitivity testing to isolate which assumptions matter most. Watch those signals closely to protect cash flow and performance.
Avoid treating sales separate from cost and expenses. Siloed views can show strong revenue while masking margin erosion.
Update assumptions regularly, document every material change, and recalibrate the model on a monthly cadence so the plan stays a living tool.
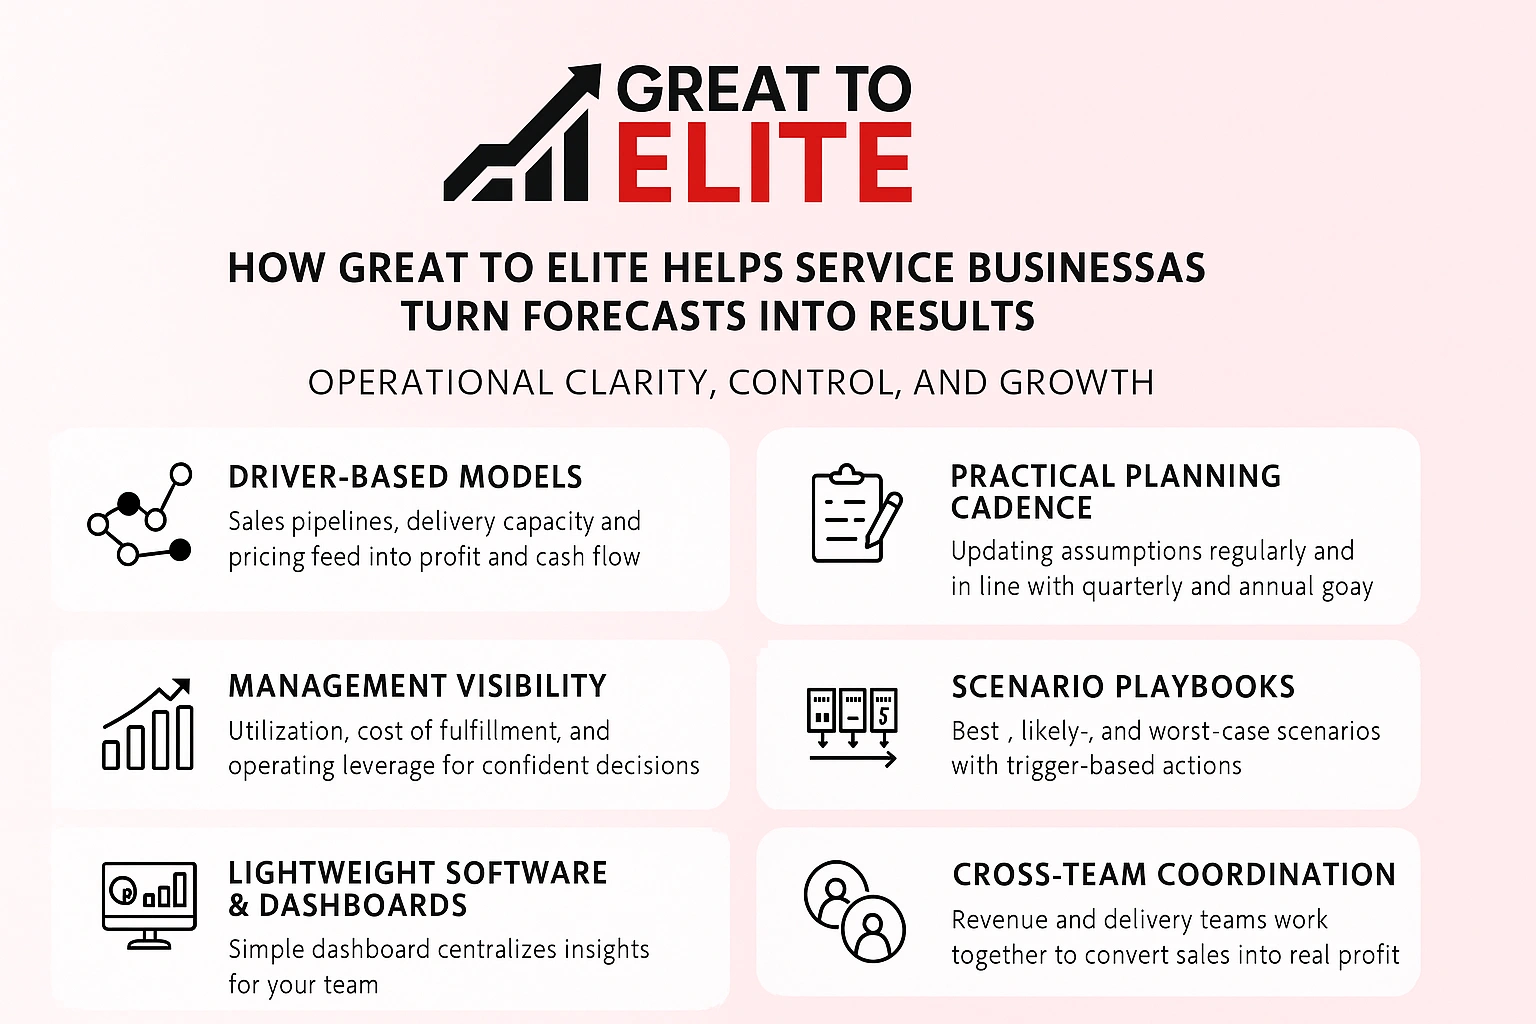
Great to Elite helps service teams turn model outputs into clear operational steps that drive measurable change.
We focus on tightening assumptions, improving cost efficiency, and matching delivery capacity to customer demand. That makes planning a practical tool rather than a monthly exercise.
Our work centers on three outcomes: clearer management lines, faster decisions, and optimized cash flow. Leaders gain the ability to act on data, not guesswork.
Ready to turn planning into measurable results? Book a call with Great to Elite to sharpen your model, align strategy, and safeguard cash flow as you scale.
A practical model links sales, costs, and cash so management can act before small issues grow.
Use a disciplined profit forecast paired with a clear revenue view to connect data to action and push toward measurable goals.
Document assumptions, set a regular update cadence, and test likely, best, and worst scenarios. Those steps make the forecast more reliable and improve performance over time.
This process gives leaders a clearer way to make decisions about growth, capacity, and investment while keeping cash and customer outcomes in view.
It also strengthens communications with investors and internal teams, and clarifies what must happen and why. Apply the steps here, keep the model living, and use it to shape the future your business intends to build.
