Cost Efficiency Strategies for Trade Businesses
Cost Efficiency Strategies for Trade Businesses

Natalie Luneva
November 11, 2025


Cost efficiency is the balance between the resources a business puts in and the results it gets out. For trade businesses, this means ensuring that labor hours, materials, equipment, and overhead are used in a controlled and deliberate way, so every job maintains a healthy margin. It’s not simply lowering expenses. It’s designing your operations so waste is minimized, pricing is accurate, schedules run cleanly, and jobs are delivered without rework or hidden losses.
In trade work, the main sources of inefficiency often come from mismatched quotes and real job conditions, inconsistent time tracking, unclear scope changes, poor supplier selection, and the back-and-forth caused by manual paperwork. These gaps don’t just add cost, they erase profit silently. A business can be full of work and still struggle financially if those inefficiencies aren’t measured and managed.
In field services, every route, crew, and shift shapes your margin and customer promise.
Why this matters: You must tell the difference between doing work with minimal waste and doing work that achieves the right outcome. That clarity helps your team make smarter choices on routing, staffing, and tools.
Being cost-efficient means you run processes with little waste of time or materials. Being cost-effective means you reach the required result for the resources spent.
Both matter. You evaluate process and outcome so your business balances speed with service quality.
Apply this formula to compare routes, crews, or plans. Measure outputs (jobs completed, callbacks avoided) and divide by the costs incurred to get a clear ratio.
Compare Plan A: $6,000 per month for 1,200 jobs and Plan B: $5,500 for the same 1,200 jobs. Plan B yields more service output per dollar, so it is more cost-efficient.
When margins tighten, every minute on a job and every dollar spent must prove its value. In periods of rising expenses and shrinking margins, you protect profit by cutting waste and optimizing how teams work.
Treat time and money as scarce resources that must generate measurable output on each project. Track how much time is lost to rework, callbacks, or idle crews so you can target the specific costs that erode margins without improving quality.
Prioritize field readiness: right materials, accurate scopes, and clear work orders keep technicians productive and reduce delays. Map where money leaks occur—over-ordering, fuel-heavy routing, and idle tools—and assign owners to stop those losses.
Convert cost efficiency into action and remove low-value tasks, automate repetitive steps, and show field and office teams how savings improve schedules and take-home pay. Small, consistent moves protect profit and preserve customer satisfaction.
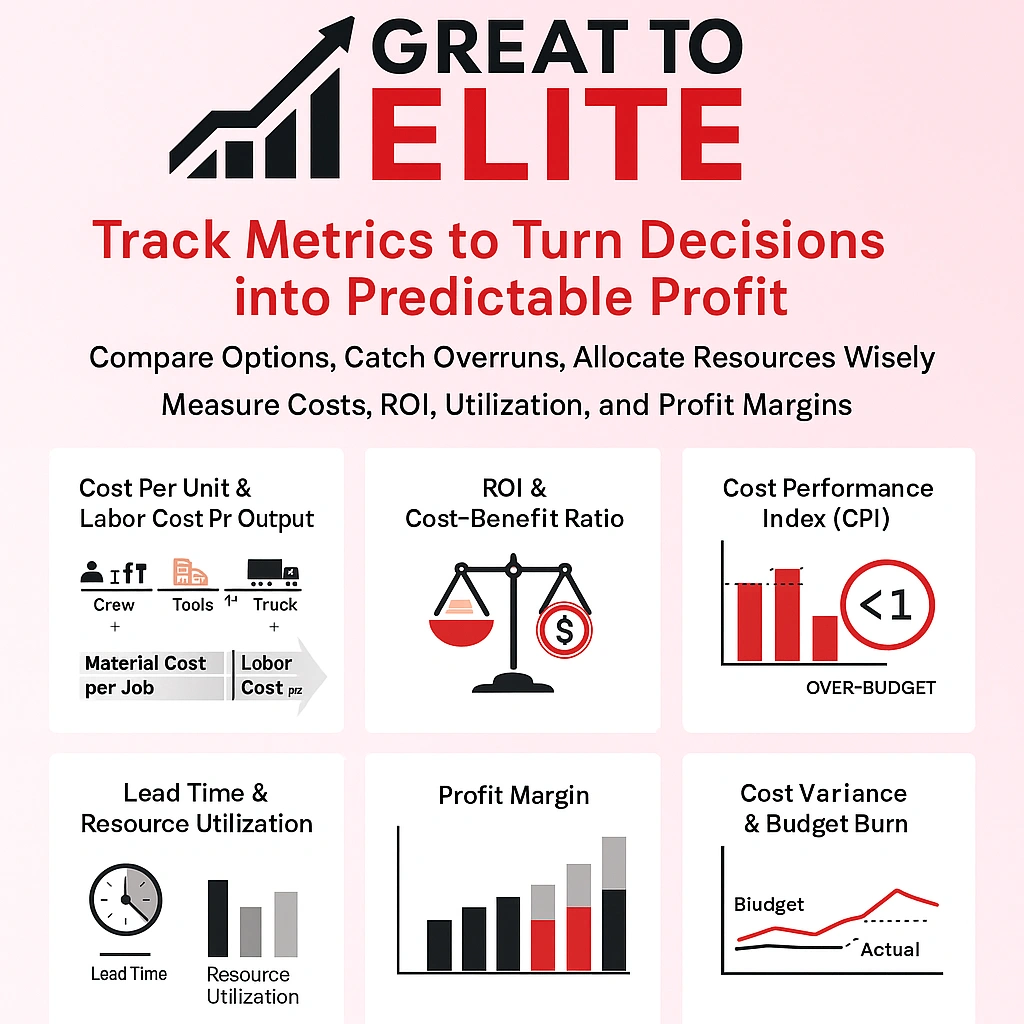
Track a handful of clear metrics to turn day-to-day choices into predictable profit. These numbers help you compare options, catch overruns early, and decide where to invest—tools, training, or trucks.
Calculate how much you spend to deliver one service or installation. Break out material spend and labor hours so you see where savings matter.
Use one example per job type so your crew can replicate the math and compare performance across teams.
ROI shows if an investment returns more value than it uses. The cost‑benefit ratio compares total benefits to total spend for a clear decision rule.
Cost Performance Index (CPI) = earned value ÷ actual costs. A CPI below 1 flags projects running over budget so you course-correct fast.
Lead time measures start-to-finish cycle speed. Shorter cycles free cash and reduce production waste.
Track utilization rates for crews and equipment to place resources where they earn the most. Compare profit margin by service line to spot winners and laggards.
Cost variance shows the gap between planned and actual spend. Budget burn tracks how quickly a job is consuming funds against its timeline.
Monitor these weekly to reallocate materials or labor before small overruns become big problems.
When you weigh investments for a project, clear numbers stop guesswork and speed smart choices.
Name the project and success criteria. Define deliverables, timeline, and who signs off so the review stays focused on what your business must achieve.
List direct cost items like labor and materials and indirect items such as overhead. Add opportunity losses, intangible risks to brand or safety, and any compliance exposures.
Capture benefits beyond revenue: fewer callbacks, faster invoicing, better customer satisfaction, and time savings that free crews for billable work.
Use company historicals and job costing to assign realistic values. Compare two or more options side by side to see which yields the best net benefit.
Make recommendations defensible, document assumptions, and the expected costs incurred. Capture lessons learned so every analysis improves how your teams make decisions.
Small changes in scheduling and tracking unlock measurable savings on each job. Use these practical steps so your field crews and office staff act on the same priorities every day.
Build job budgets with clear labor, material, and overhead assumptions so foremen manage to targets daily.
Track time to spot underestimation or scope creep. Re-baseline when actual hours diverge and communicate updates quickly.
Weigh options by return rather than sticker price. A cheaper part or vendor can raise downstream expenses if it causes rework or callbacks.
Offer better communication, short warranties, or bundled preventative checks that improve customer outcomes with little added spend.
Standardize closeout checklists and handoffs to protect quality and reduce repeat visits.
Implement routing and staging strategies that cut windshield time and idle periods. Use time studies to kit materials and streamline install steps.
Share current dashboards with crews so decisions use up-to-date data, not assumptions.
Streamlining how work flows between office and field frees your team to finish more jobs on time. Focused process changes and selective automation cut repetitive work and boost field productivity. Organizations can cut indirect costs by as much as 15 – 20 % in 12‑18 months through tech‑enabled cost reduction (automation, AI) of shared services such as finance, procurement, HR, IT.
Automate recurring tasks like work order creation, status updates, and follow-ups so office staff and technicians spend more time on productive work. Reducing manual data entry lowers error rates and prevents rework that drives extra cost.
Build a playbook that pairs employee skills, specialized equipment, and correct parts with job scopes. Better resource matching raises first‑time fix rates and keeps high‑value resources engaged without burnout.
Tighten approvals, pre‑kit materials, and coordinate supplier deliveries to align with schedules. Shorter lead times cut inventory on hand and let you bill faster.
How you price work and manage suppliers directly affects workflow, stock levels, and cash flow. Choose approaches that match how your teams deliver and how your customers buy.
Hourly can be fair but may not reward speed. Project pricing helps planning but can expose you to underestimates.
Retainers give steady revenue and predictable load. Performance-based fees align pay to outcomes and can improve field productivity.
Invite multiple bids for recurring parts and use volume tiers to lower per-unit purchase. Competition keeps vendors honest and raises service levels.
One preferred vendor simplifies ordering and invoicing. Pair that convenience with contingency plans and secondary sources so supply shocks don’t stall production.
Link procurement timing to project schedules and demand forecasts. Real-time dashboards and basic software controls show reorder points and slow-moving stock.
Keeping gains requires a simple habit: measure what you change and revisit it on a steady schedule. A short, consistent reporting cadence keeps teams accountable and makes problems visible before they grow.
Run a weekly snapshot for production, spend, and schedule health so you flag issues fast. Keep this short—three charts and two action items is enough.
Hold monthly reviews to compare planned versus actual costs, confirm that initiatives are delivering, and assign owners for corrective steps.
Quarterly deep dives reset targets, refine strategies, and prioritize the next wave of improvements based on trend analysis.
Deploy a software-driven solution that shows budget burn, variance, and project health on one screen. Strong visibility reduces reaction time and lets supervisors act early.
Make measurement the way you run the company: compare current analysis to prior periods and integrate procurement visibility so spend aligns with demand and avoids surprises.
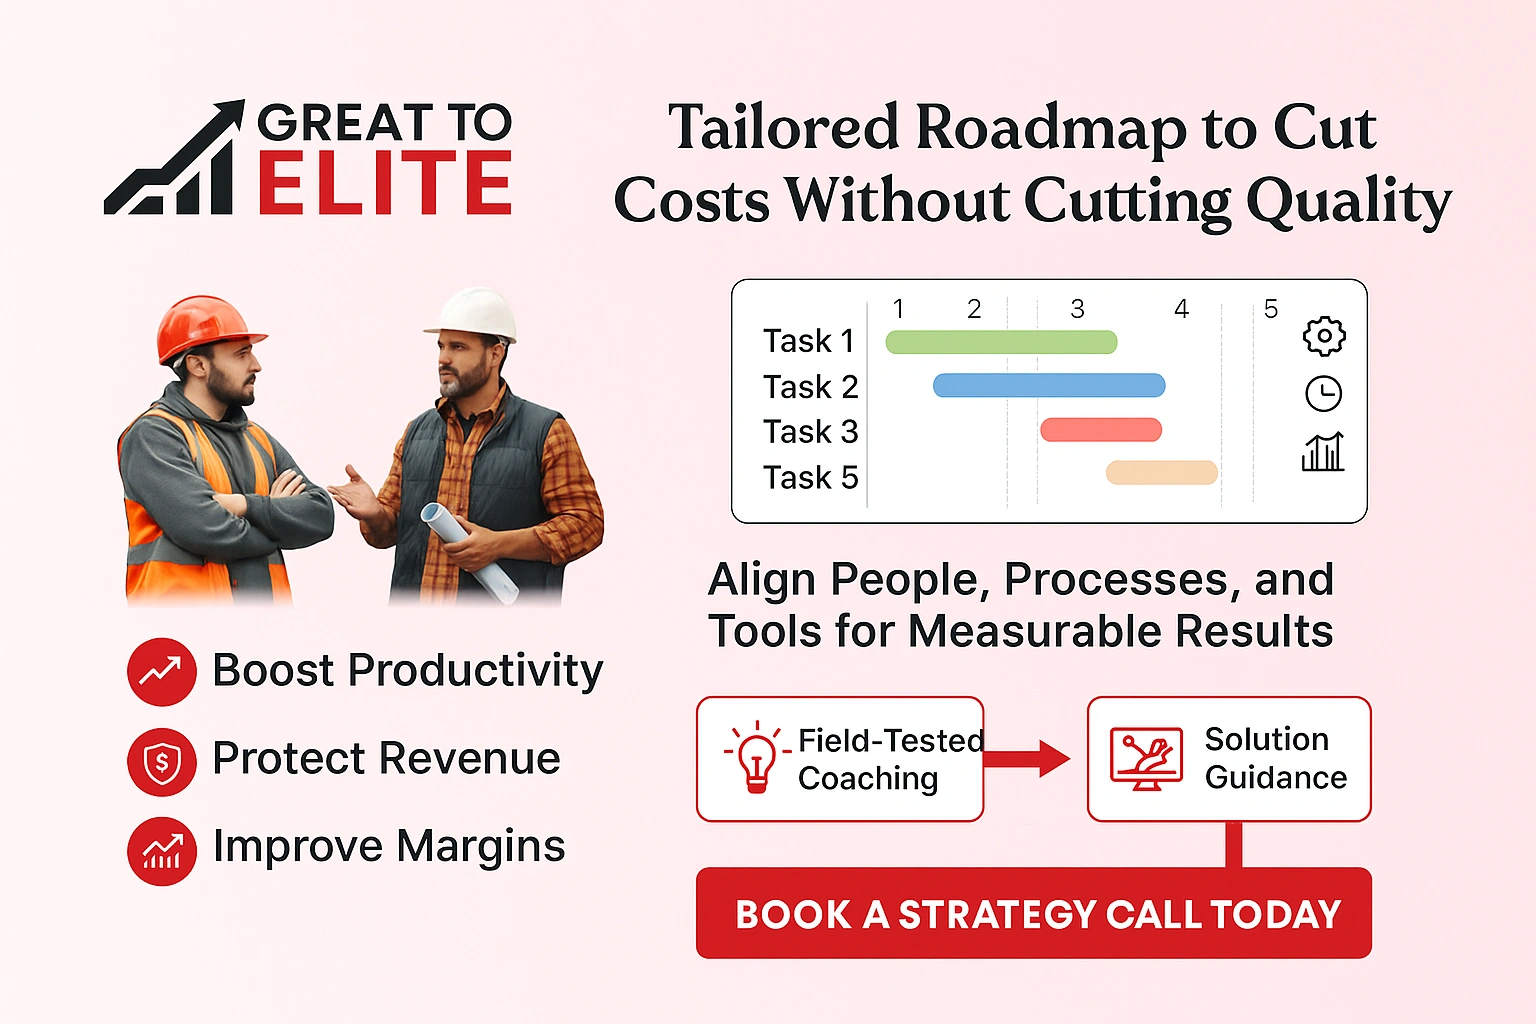
Great to Elite helps businesses align strategy, people, and execution so you implement the metrics, processes, and tactics in this guide with speed and confidence.
You’ll receive a customized roadmap that targets quick wins and long‑term levers for a cost-efficient business and profitable growth. Great to Elite shows a practical way to reduce costs while strengthening customer experience and on-time delivery.
Book a call now to start capturing measurable results in weeks, not months. Partner with advisors who understand trade services and how to scale process discipline in real-world conditions.
A disciplined approach to measurement and process turns small changes into reliable profit lifts. You now have a practical playbook: clear formulas, example-driven analysis, and metrics that link actions to results.
Small shifts in tasks, scheduling, procurement, and inventory add up to real savings in time and money. You can prove benefits with CPI, lead time, and simple unit math and keep customer service and quality intact.
Make reporting and automation part of daily routines so gains stick. If you want to accelerate results, partner with Great to Elite to operationalize these strategies and protect revenue across your production and service operations.
