How to Calculate Enterprise Value
How to Calculate Enterprise Value

Natalie Luneva
January 20, 2026
.webp)


Enterprise Value (EV) is the total cost to acquire a company’s operations, taking into account all debt and other financial claims, while subtracting cash the company holds. Unlike market capitalization, which only reflects the value of equity, EV gives a complete picture of what it really costs to buy a business. More than 70% of acquisition models rely on EV rather than equity alone because it captures debt obligations and cash that affect the net purchase price
A clear view of a company’s total worth combines market price with the claims held by lenders and cash on hand. This measure captures market capitalization, short- and long-term debt, and cash or equivalents to reflect the net cost a buyer would face.
For investors and buyers, this metric shows the value of the core operating business that both equity holders and lenders can claim. It is more complete than market cap when capital structure matters.
Operationally, the metric measures the economic claim on ongoing operations, ignoring excess non-operating cash. It becomes the numerator in common ratios used to compare companies.
In mergers, an acquirer assumes debt and gains cash. That means the net acquisition cost often aligns with the combined claims figure, not headline market cap.
Two firms can share the same market cap yet differ in total worth if one holds large cash reserves and the other carries heavy debt. Confusing these terms is a common source of mispricing and poor comparisons, which the next section will untangle.
A firm’s stock market headline can hide important claims that affect the true cost of buying its operations. Market figures capture one slice of worth, while a broader measure brings lenders and cash into view.
Equity value is the market amount attributable to common shareholders. Conceptually, market capitalization equals stock price × shares outstanding. Analysts often use diluted shares for a cleaner picture.
Market cap shows only owners’ claims. It ignores debt obligations and the offsetting effect of cash on the balance sheet.
Two firms with the same stock and shares can look identical by market cap yet differ sharply when debt and cash are added or subtracted.
Market cap covers shareholders alone. The broader measure adds lenders and other claimants, making comparisons fairer across capital structures.
Start with a simple equation that brings market price, borrowing, and cash into one clear measure. The core formula shows what an acquirer effectively pays for operations after accounting for claims and liquid reserves.
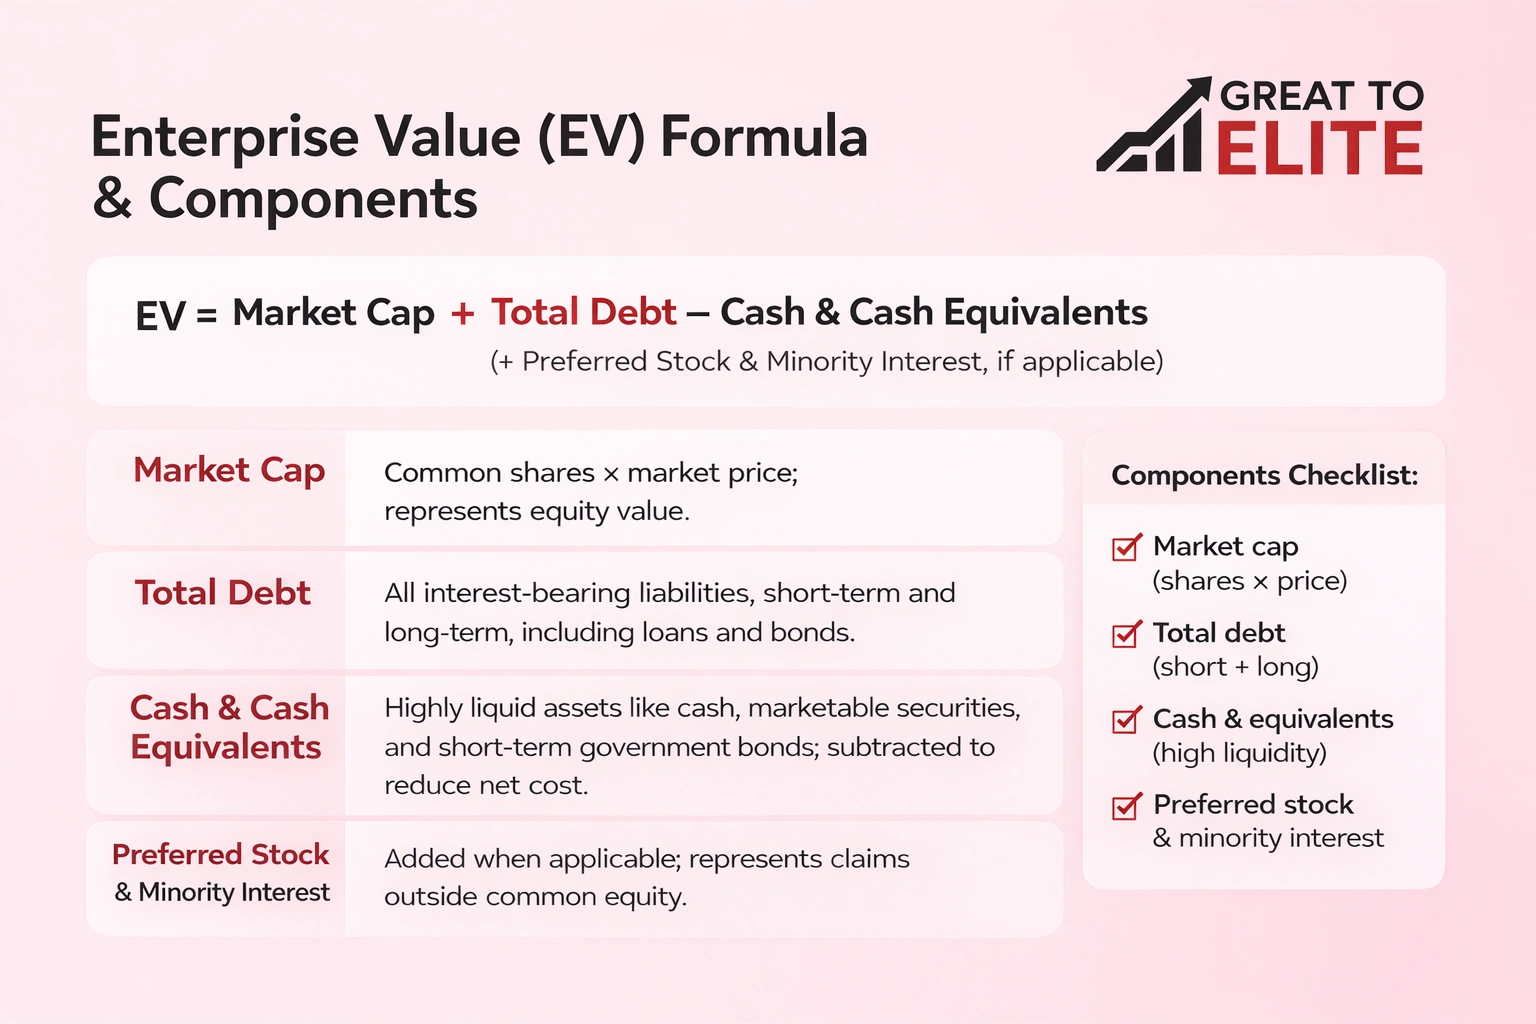
Core equation: EV = Market Cap + Total Debt − Cash and Cash Equivalents.
Market cap represents common equity market price multiplied by shares outstanding. Total debt aggregates interest-bearing liabilities. Cash and short-term liquid holdings reduce the net purchase cost.
Total debt means interest-bearing liabilities on the balance sheet.
Include highly liquid items such as marketable securities, money market funds, commercial paper, and short-term government bonds.
Cash is subtracted because a buyer inherits these assets and can use them to pay down liabilities, lowering net acquisition cost.
Add preferred equity and minority (noncontrolling) interest when statements consolidate subsidiaries or when preferred claims exist.
These items represent claims not captured by common market price but that an acquirer must consider for full operational control.
Components checklist:
Match market feeds with the company’s reported lines on the statements. Pull a current share price and then find the matching shares outstanding in filings. Keep dates aligned so the numbers reflect the same "as of" period.
Get the latest market quote for the stock from an exchange or a reliable data provider. Use diluted shares when possible for a cleaner equity picture.
Shares outstanding usually appear in the equity section of filings or a cover page summary. Filings and investor presentations often list diluted counts.
On the balance sheet look for short-term borrowings, current portion of long-term debt, and long-term bonds. Focus on interest-bearing debt items when totaling obligations.
Cash and cash equivalents sit among current assets near the top. Include marketable securities and money-market items shown on the sheet.
Market values for debt often lack public quotes. In practice, use book value from the balance sheet as a practical proxy for total debt.
Be consistent when comparing peers. Once inputs are gathered and dated consistently, the next step is a straightforward computation.
Follow a short, practical checklist that turns market data and balance sheet lines into a single purchase-price figure.
Step 1: Multiply the current share price by the reported shares outstanding on the same date. Use diluted shares if available for a cleaner market capitalization figure.
Step 2: Add short-term borrowings, the current portion of long-term debt, and long-term interest-bearing loans or bonds. Exclude non-interest operating liabilities like trade payables unless they carry interest.
Step 3: Subtract cash and cash equivalents from the subtotal. This reflects that a buyer inherits liquid assets that can offset purchase cost.
Step 4: If the company reports preferred stock or noncontrolling interest, add those lines. They represent claims an acquirer must address for full operational control.
Quick EV Build: EV = Market Cap + Total Debt − Cash (+ Preferred Stock + Minority Interest).
A negative enterprise value can arise when cash and equivalents exceed market cap plus debt. This is rare and may signal excess liquidity or weak operating prospects.
Don’t assume cheapness. Check why cash is high and whether core operations sustain long-term returns.
Below is a compact, realistic illustration that turns market figures into one purchase-price number. Follow the steps and numbers to replicate the method on your own company or a peer.
Inputs (illustrative):
Interpretation: The computed figure represents the estimated total worth of operating business claims held by equity and lenders. This is the net check size an acquirer would face for operations before any takeover premium and transaction costs.
Sensitivity note: If cash rises by $100 million, the figure falls to $3,300 million. If long-term debt drops by $100 million, the figure falls to $3,300 million as well. Small changes in cash or debt shift this total directly.
What to do next: Use this number for multiples and peer analysis rather than relying on market cap alone. Great to Elite can help interpret multiples and run scenario analysis for deal planning.
A simple misclassification can skew comparisons and derail deal math.
Confusing equity value with enterprise value is the top conceptual error. Market capitalization reflects only shareholders’ claim. If you use it as the total company figure, M&A pricing and peer comps break.
Using gross debt without subtracting cash and cash equivalents inflates results. That mistake double-counts financing capacity and overstates net purchase cost. Build net debt logic: add interest-bearing debt, then subtract liquid assets.
Omitting preferred stock understates the true claim structure. Preferred often behaves like fixed claims an acquirer must satisfy.
When a firm consolidates a subsidiary, remember minority. If you include 100% of operating results, add the minority line so the total reflects full economic claims.
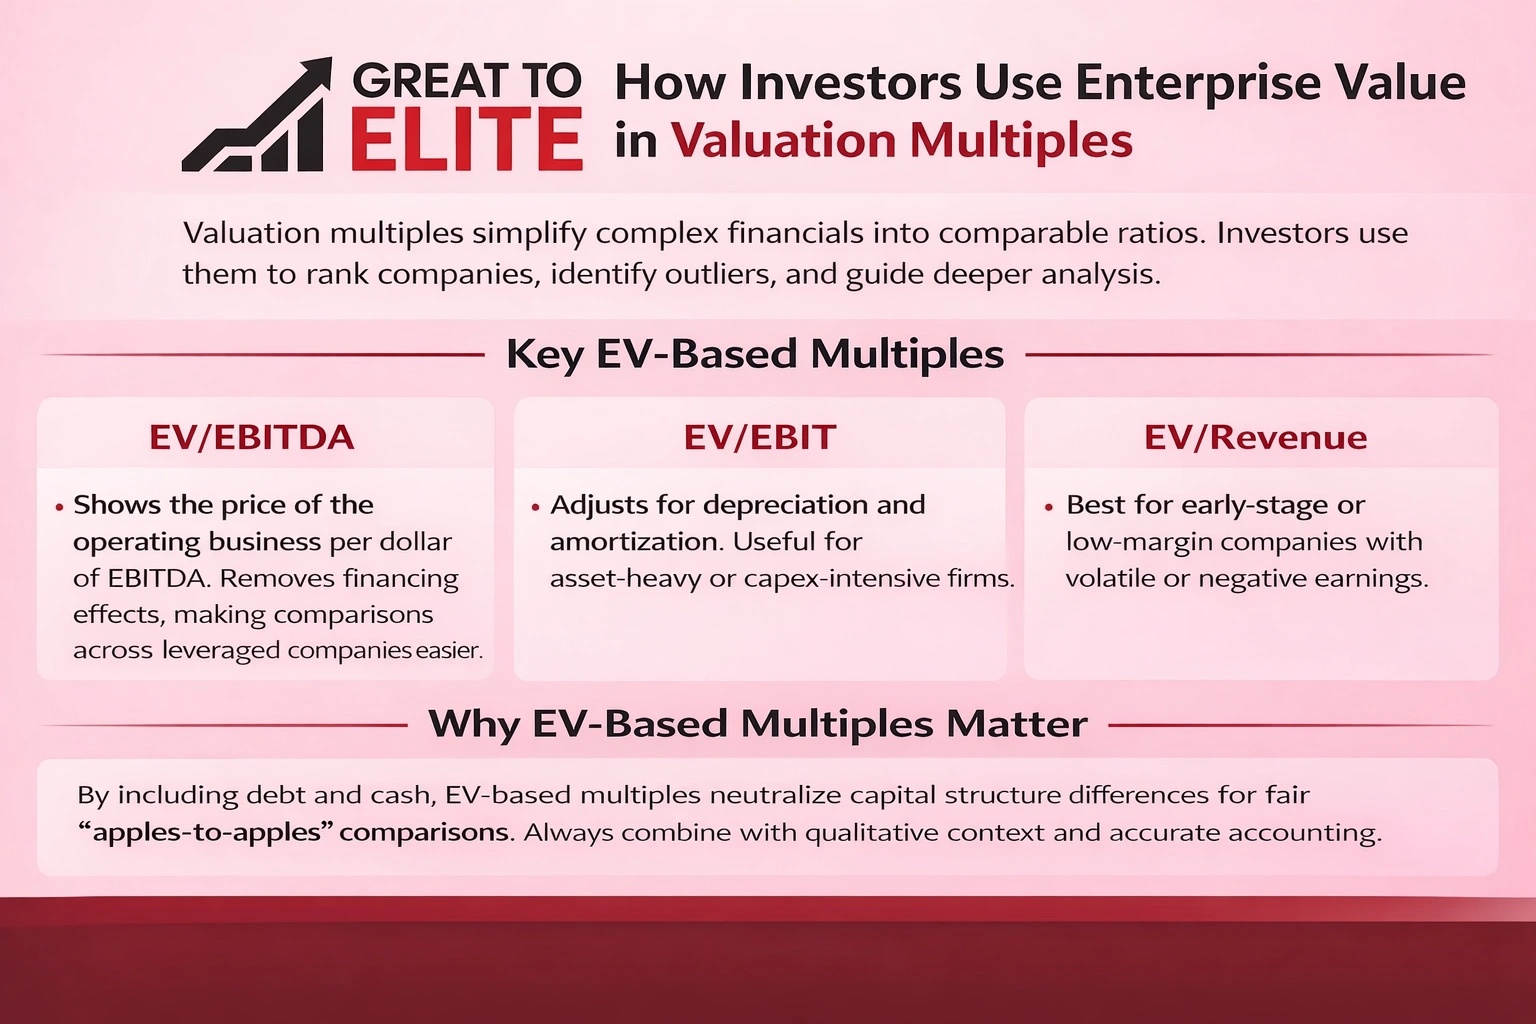
Valuation multiples shrink complex financials into a single, comparable line for rapid screening. Investors use these ratios to rank companies, flag outliers, and guide deeper analysis.
EV/EBITDA shows how much the market prices the operating business per dollar of EBITDA. It removes financing effects and includes debt and cash, letting investors compare firms with different leverage profiles. That clarity explains why this multiple is a standard in valuation work.
EV/EBIT adjusts for depreciation and amortization. Use it when capex intensity or asset aging matters. EV/Revenue fits early-stage or low-margin firms where earnings are volatile or negative. Each ratio emphasizes a different performance lens.
Because the numerator aligns with claims across equity and creditors, EV-based multiples neutralize distortions from capital structure. That makes cross-company comparisons fairer than equity-only measures.
Caution: Multiples depend on consistent accounting and accurate inputs. Revenue recognition, interest treatment, and one-off items can skew ratios. Combine multiples with qualitative business context and other checks rather than relying on one metric.
Numbers tell a story, but context decides whether that story is useful for investors. EV is a strong metric, yet it is not a standalone truth. Use it with other measures and qualitative judgment when assessing a company.
Capital-intensive sectors often carry more debt as part of normal operations. That higher borrowing can make enterprise value look large relative to equity without meaning the firm is overvalued.
Compare companies within the same industry to avoid mismatched capital structures and distorted multiples.
Management may use debt for growth, acquisitions, or working capital. Leverage can signal investment or stress. Pair EV with cash flow and profitability analysis before drawing conclusions.
Align dates when pairing market price and balance sheet lines. Market quotes reflect a point in time while assets and liabilities post at period end. Consistent inputs improve the reliability of any valuation analysis.
Turning metrics into decisions often requires structured interpretation and planning. Great to Elite can help translate this analysis into actionable strategy.
Turning raw market and balance sheet figures into clear strategic actions makes the numbers useful for leaders. Great to Elite links the calculation result with practical steps that affect pricing, capital planning, and deal readiness.
We confirm inputs from market feeds and company statements, then standardize definitions for repeatable results.
Next, we build a transparent calculation and show which drivers matter most for your business and peers.
Before the Conclusion: We help you clarify what enterprise value indicates about acquisition cost and capital structure.
We identify the inputs and assumptions that shift your valuation over time.
We build a consistent approach for peer comparisons and translate data into next steps: capital planning, growth priorities, or deal prep.
Book a call with Great to Elite to review your calculation, assumptions, and a short action plan. The session is focused, consultative, and designed for business leaders who want practical next steps after an analysis.
Keep this short checklist handy when you review a company’s capital mix and reported figures.
Core takeaway: enterprise value gives a clearer picture of a company’s total worth, as it combines market capitalization, equity and interest-bearing debt, then subtracts cash and cash equivalents.
Formula reminder: EV = market cap + total debt − cash. Add preferred stock and minority interest when present. Debt raises claims on the business; cash lowers the net acquisition cost.
Follow a stepwise process: get market price and shares, add total debt, subtract cash, and include other claim lines if needed. Use EV-based multiples like EV/EBITDA for fairer valuation and comparison.
Best practices: align dates, keep definitions consistent across companies, and validate inputs from statements. Apply the method to a company you follow and use the result in valuation analysis and deal planning.
