Business Process Improvement Techniques for Increased Profit for Trade Businesses
Business Process Improvement Techniques for Increased Profit for Trade Businesses

Natalie Luneva
November 14, 2025


Business process improvement techniques are systematic methods used to analyze, redesign, and enhance the way a business operates. They go beyond surface-level fixes, focusing on the root causes of inefficiencies, whether that’s slow workflows, communication gaps, or repeated errors. These techniques involve mapping out every step of a process, identifying bottlenecks, measuring performance, and implementing changes that save time, optimize costs, and improve quality.
For trade businesses, where projects are time-sensitive, margins are tight, and coordination between field teams and office staff is needed, applying these techniques can be a game-changer. With structured improvement methods, trade businesses can streamline operations, prevent revenue leakage, and ensure projects are completed on time, within budget, and to the highest standard.
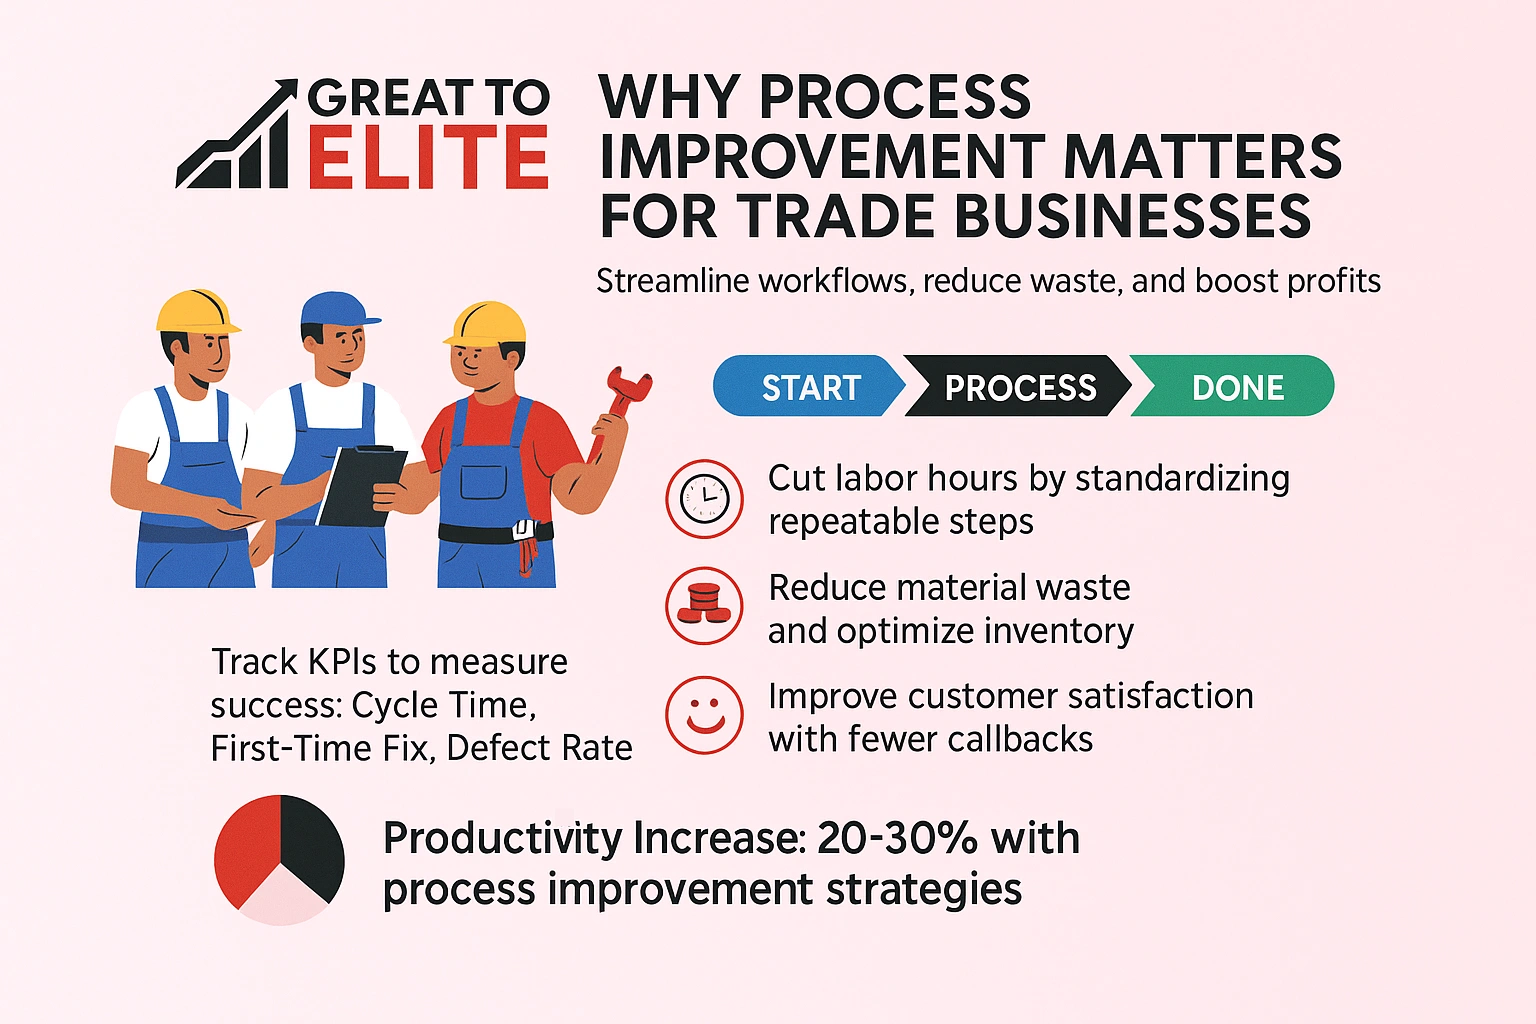
Delays, missed parts, and unclear scopes quietly erode your margins and customer trust. Organizations that implement process improvement strategies see an average productivity increase of 20–30%. Regularly refining how work flows keeps crews productive and reduces hidden costs. Clear, documented steps help teams adapt when demand or products change.
Focus on a few high-impact areas to lift margin and value. Make decisions local when possible, so crews don't wait for approvals and time per job falls.
Track a small set of KPIs, cycle time, first-time fix, and defect rate, to see if changes move the needle. Small, frequent adjustments protect working capital and keep quality steady as you scale.
When teams follow the same reliable steps, variation drops and results improve.
Document the few actions that must be the same every job, scope check, safety sign-off, and quality approval. Use short, job-specific checklists so crews confirm materials, tools, and access before leaving the yard. This cuts no-shows and repeat visits.
Trace a defect back and ask “why” until you reach an upstream gap. Map causes across materials, methods, measurements, people, environment, and equipment. Fixing the root keeps the symptom from returning.
Review yesterday’s jobs each morning. Praise first-time fixes, note checklist misses, and assign a 24–48 hour trial change. Measure impact on cycle time and rework rates to decide what sticks.
Use status columns (scheduled, dispatched, in‑progress, quality check, invoiced) and simple photo control points. Shared boards and mobile capture make the right way the easy way.
Draw the full customer journey so everyone sees where work actually stops and starts.
Sketch the current state from first inquiry through scheduling, dispatch, field work, quality check, invoicing, and follow-up. Name each step, who owns it, what triggers it, and what “done” means.
List suppliers (internal and external), required inputs like specs, parts, and permits, core steps, outputs (completed job, invoice, documentation), and the receiving customer for each output.
Annotate time spent and wait time to reveal stalls, often in scheduling, parts staging, inspections, or invoice approval. Mark steps customers would pay for versus internal-only steps and target the latter for removal.
Revisit the map monthly to track gains and keep teams aligned. Simple symbols and swimlanes reduce finger-pointing and make ongoing analysis practical for field and office management.
Find where jobs stall, calendar, parts room, or inspection queue, and act on it first. A focused effort on the primary constraint yields fast, visible gains. Targeted fixes give teams momentum and proof that change pays.
Look where work stacks up: full schedules, piled orders, or a single skilled role. Track how long items wait and count how many jobs pile behind that point.
Quantify the impact with simple KPIs: jobs per day per crew, average wait for parts, and inspection turnaround. That data tells you which bottlenecks to tackle first.
Start with short, reversible actions that lift capacity in 1–2 weeks. Try job batching, dedicated staging, pre-inspection checklists, or cross-training one role.
Align upstream steps to feed the constraint, freeze scopes 24 hours before dispatch, pull work downstream, and fast-track checks and invoices.
Spotting routine waste in trips, waiting, and searches makes crews far more productive. Start with small audits of daily work to reveal time sinks and repeat defects. Use simple rules you can test this week.
Confirm job readiness the day before: access, parts, and permits. That eliminates waiting on site and idle crew hours.
Organize trucks and shops with labeled locations for common tools to cut excess motion. Minutes saved searching add up across the day.
Batch deliveries and combine nearby jobs to limit back-and-forth driving and lower miles per job.
Match documentation and photos to what’s needed for quality verification, no extra paperwork. This prevents overprocessing and wasted time.
Define acceptance criteria for routine tasks (for example, torque values or test steps) and capture proof-of-work photos at key checkpoints to reduce defects.
Analyze usage frequency and set min/max levels for fast movers. Order specialty items to job to free cash from overstock.
Stage materials to a frozen scope 24 hours before dispatch and verify model numbers and counts. First-time fix rates rise and callbacks fall.
Tap the people who do the work daily to spot hassle and suggest fixes. When field and office teams contribute small ideas, you widen the pool of practical fixes and lower resistance to change. Use short cycles so learning happens fast and stays safe.
Invite employees to submit one-week ideas, simple, testable, and low risk. Lower the bar: quick notes or photos are enough to enter a trial.
Prioritize suggestions with a clear hypothesis and a simple success metric, like shaving five minutes from staging or raising first-time fix rate on one job type.
Run trials on a single crew or job type for days, not months. Plan, test, review, then adopt or archive the result.
Rotate facilitation among supervisors so improvement skills spread and don't depend on a single champion.
Share results openly and recognize wins publicly. Reward measurable outcomes, fewer callbacks, better schedule adherence, or safer sites, to reinforce the goal.
Track a few tight metrics and you catch issues long before they hit a customer or the ledger. Define clear, job-family KPIs so everyone knows what "good" looks like and where to act.
Set a small set of must-track measures per job family: cycle time, first-time fix rate, defect/rework rate, and schedule adherence.
Instrument your workflow to capture timestamps, parts usage, and checklist completion automatically when possible. That reduces manual entry and errors.
Set control thresholds for each KPI and trigger a rapid review when performance drifts. Catch problems early to avoid customer issues and revenue loss.
Close the loop: pair dashboard trends with customer feedback and proof-of-work photos. Hold short, scheduled huddles to assign actions and confirm fixes. This keeps quality, control, and customer satisfaction moving in the same direction.
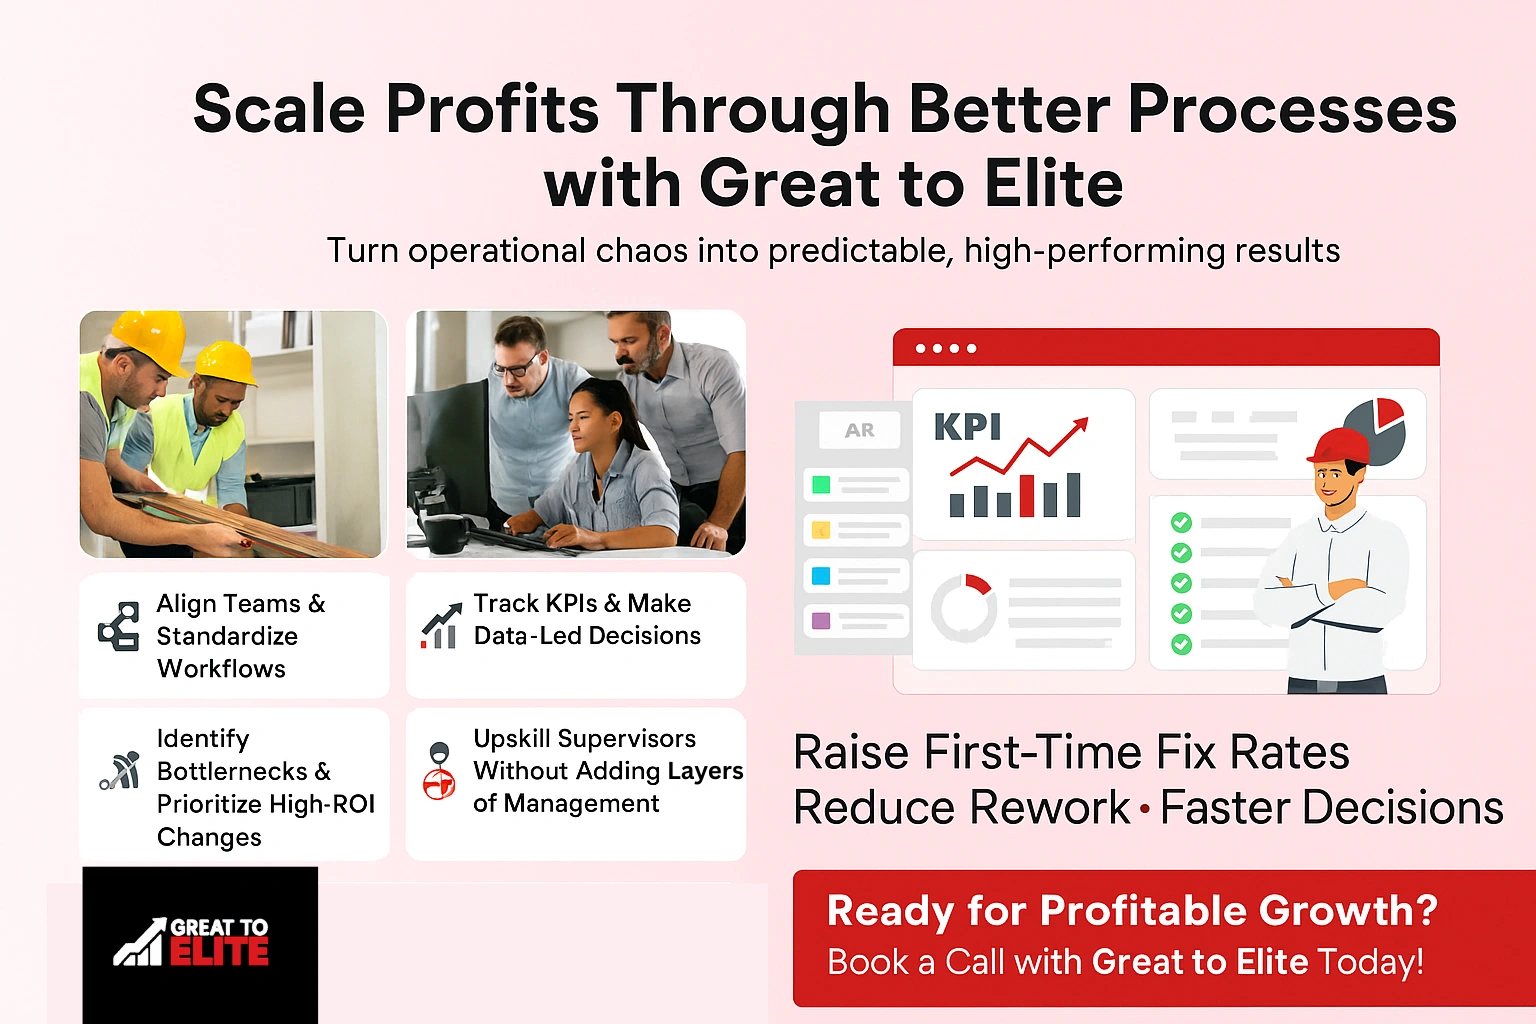
Scaling profits starts with making day-to-day work predictable and measurable. Great to Elite guides you to align teams, set clear KPIs, and use visual tools so decisions are fast and grounded in facts.
You get hands-on help to map current workflows, name owners, and remove guesswork from daily execution. Leadership, office staff, and field crews follow one documented way of working that speeds execution and cuts rework.
Standardization covers scheduling, staging, dispatch, quality checks, and invoicing so every job follows a clear path with defined handoffs and proof-of-work.
Practical tools and dashboards make performance visible at a glance. That visibility lets you make faster, data-led choices each day and week.
Great to Elite helps you pinpoint the true bottleneck, prioritize a short list of high-ROI changes, and run short trials to scale what works.
With guided support, you translate strategy into shop-floor behavior, raise first-time fix rates, and turn operational chaos into predictable performance. If you want profitable growth, contact Great to Elite today!
Standardize the critical steps with short checklists and proof-of-work so variation drops and defects shrink. Measure a few KPIs, cycle time, first-time fix rate, and defect rate, and review them weekly for quick analysis.
Keep focus on the current bottleneck, run short trials, and adopt what works. Streamline parts staging and use visual workflows to keep field and office aligned. The result is higher productivity and stronger customer satisfaction as you scale.
