Profit per employee is one of the simplest yet most revealing metrics for understanding how efficiently your business turns its team’s work into real financial results. It shows how much profit your company generates for every person on payroll, giving you a clear measure of productivity, operational effectiveness, and overall business health.
Key Takeaways
Profit per employee reveals how efficiently your business converts headcount into real, retained profit.
The calculation is simple. net income divided by average FTEs, but accuracy depends on consistent periods and proper FTE adjustments.
This metric differs from revenue per employee by highlighting true profitability rather than top-line productivity.
Improving profit per employee requires better processes, automation, stronger talent systems, and a margin-focused cost and pricing strategy.
The ratio is most powerful when paired with complementary KPIs and industry benchmarks to guide smarter hiring, planning, and operational decisions.
Understanding Profit per Employee and Why It Matters
Profit per employee is a financial metric that shows how much net profit a company generates for every person on its payroll. It’s calculated by dividing a company’s net income by its average number of full-time equivalent (FTE) employees for the same period. In 2023, among the top 25 U.S. companies by profit per employee, the average profit per employee was$490,660.
Definition and How It Differs from Revenue per Employee
Profit per employee equals net income divided by total headcount (use FTEs for part-time staff). By contrast, revenue per employee uses top-line sales over headcount and ignores costs. Use both measures together to spot high sales with thin margins or low sales with strong cost control.
Why This Efficiency Metric Matters Now: AI, Lean Teams, and Cost Discipline
Technology and automation raise output while reducing labor intensity. That boosts net income retained for each person.
Apply the ratio to test staffing, process changes, and role design.
Compare results across your sector to set realistic targets.
Track trends over time to confirm that new tools and training actually lift income per head.
Metric
What it shows
Use case
Net income per head
Profitability after costs
Workforce sizing, margin focus
Revenue per head
Top-line productivity
Sales efficiency, growth signals
Trend analysis
Direction of returns
Validate automation and hiring choices
How to Calculate Profit per Employee
To measure returns, pair finalized income figures with the average staff level for the same period. Use audited or closed financials and a consistent headcount window to avoid mismatches.
The Formula: Net Profit Divided by Number of Employees
Formula: profit per employee = net profit ÷ number of employees.
Compute net income as total revenue minus total expenses for the chosen period. Match that period to the average headcount.
Align Periods, Use FTEs, and Gather Accurate Data
Confirm period alignment: annual profit with average annual staff, or quarterly profit with average quarterly staff.
Convert part-time and seasonal hires into full-time equivalents (FTEs).
Document which staff types you include (permanent, temps, contractors) and stay consistent.
Reconcile HRIS headcount with payroll and the financial close.
Worked Example and Practical Tips
Example: $4,000,000 net income ÷ 120 employees = $33,333 profit per employee for the year. Save the spreadsheet and repeat the calculation each close.
Action
Why it matters
Quick check
Use FTEs
Reflects true capacity
Convert hours to 1.0 FTE
Align periods
Prevents distortion
Match annual with annual
Reconcile systems
Improves accuracy
HRIS vs. payroll vs. finance
Optionally calculate revenue per alongside this metric to spot gaps where top-line growth isn’t lifting retained income. Schedule quarterly reviews and an annual close to track trends and improvements.
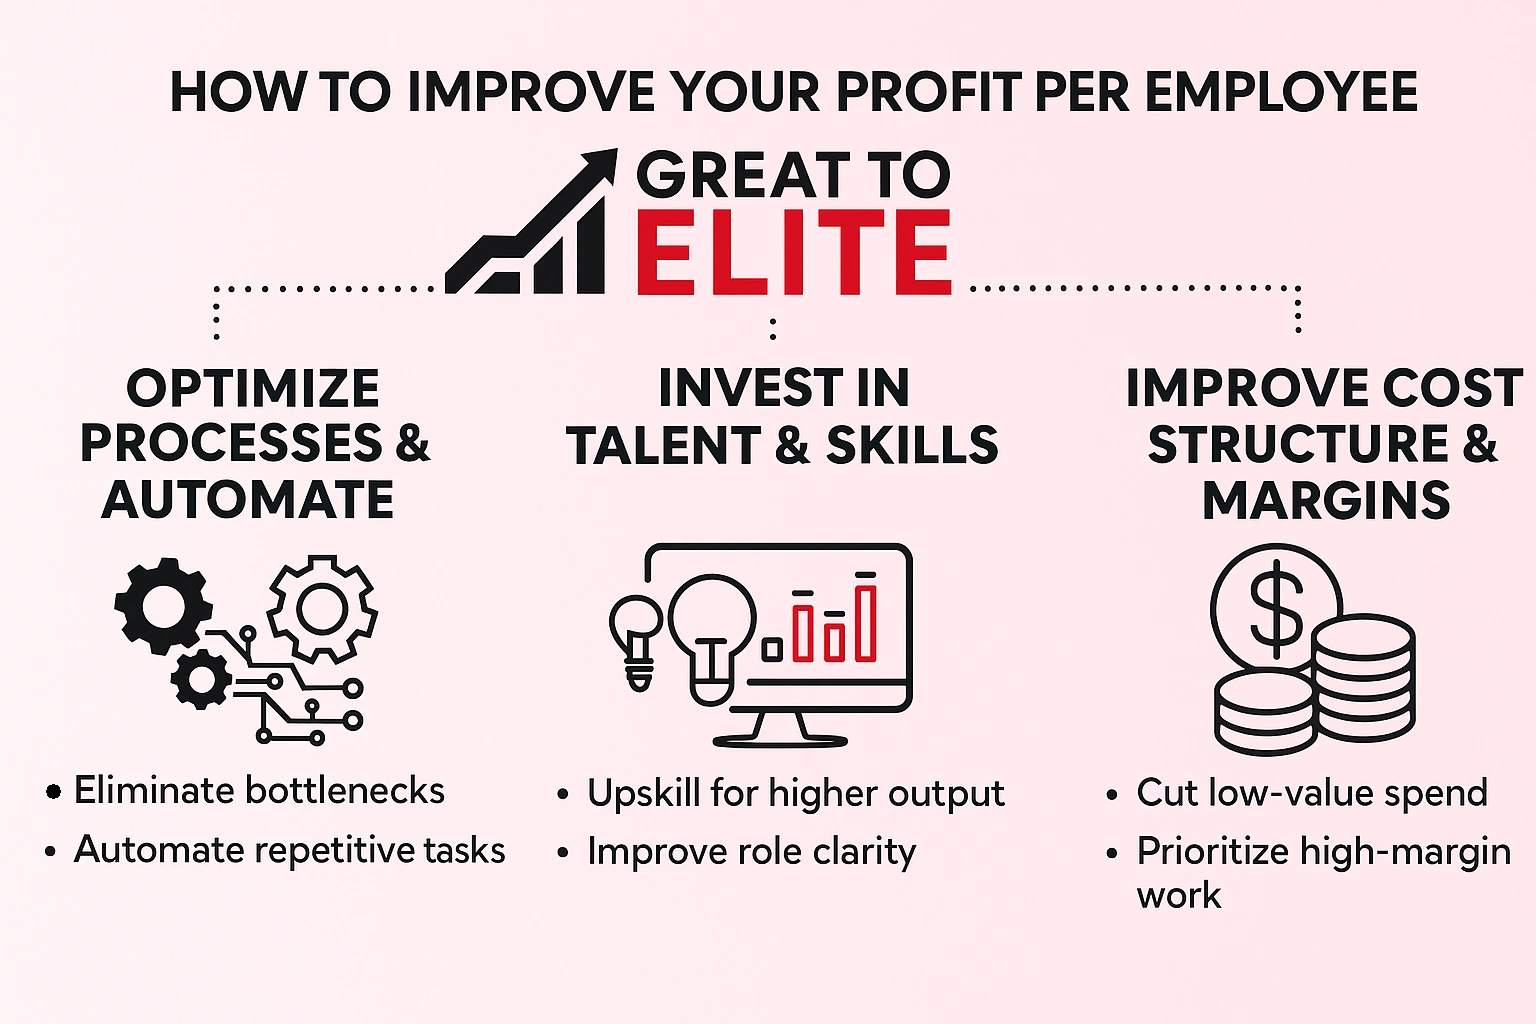
How to Improve Your Profit per Employee
Target everyday tasks that slow your teams and convert that saved time into higher retained income. Small fixes add up when you focus on flow, tools, and skills.
Optimize processes and use automation and data
Optimize Processes and Leverage Automation and Data
Map workflows end to end to find bottlenecks and rework. Standardize handoffs so each person spends more time on value work.
Deploy targeted automation for repetitive tasks and add analytics to speed decisions. This frees capacity for margin improvement.
Invest in Talent: Hiring, Upskilling, Engagement, and Performance Alignment
Tighten role clarity and scorecards so goals tie to retained income and efficiency. Hire for capability fit and faster time-to-productivity.
Invest in training to raise capability density. Pair learning with engagement initiatives so gains are sustainable and do not burn out staff.
Tune Your Cost Structure and Revenue Mix for Higher Margins
Rationalize vendor spend and fixed costs, then reinvest savings into tools and training that compound gains. Shift pricing and packaging toward higher-margin segments.
Track leading indicators, utilization, cycle time, and win rates, alongside the headline metric to confirm operational changes lift financial outcomes.
Pilot small changes, measure lift, and scale winners.
Align scorecards to reward outcomes, not activity.
Prioritize customer satisfaction so efficiency improvements translate into sustainable retained income.
Interpreting the Metric: Pitfalls, Ethics, and Complementary KPIs
A single ratio rarely tells the whole story about workforce returns. Use the number as an indicator, then look for signals that reveal whether gains are durable or risky.
Limitations and Ethical Considerations: Avoid Short-Termism and Burnout
To avoid chasing a short-term spike, cut too deep or load teams. That can cause burnout, quality decline, and legal exposure, which erode long-term income and lead to loss.
Weigh fair pay, safe workloads, and wellbeing. Hidden costs from turnover and disengagement often outweigh one-off savings.
Use With Other Metrics: Revenue per Employee, Workforce Size, Turnover, and L&D ROI
Triangulate the main ratio with measures that show capacity, margin, and talent health. This helps you tell if a rise comes from better mix or unsustainable understaffing.
Compare against sector average and your unit economics to set realistic targets.
Track turnover, hiring costs, and time to proficiency to spot hidden drains on returns.
Measure L&D ROI and engagement to ensure training lifts income by head.
Document FTE assumptions and number employees for audit-ready comparability.
Metric
What it shows
Use
Revenue per head
Top-line productivity
Margin vs. volume analysis
Turnover rate
Talent stability
Cost of churn and hiring
L&D ROI
Skill impact on outcomes
Guide training investments
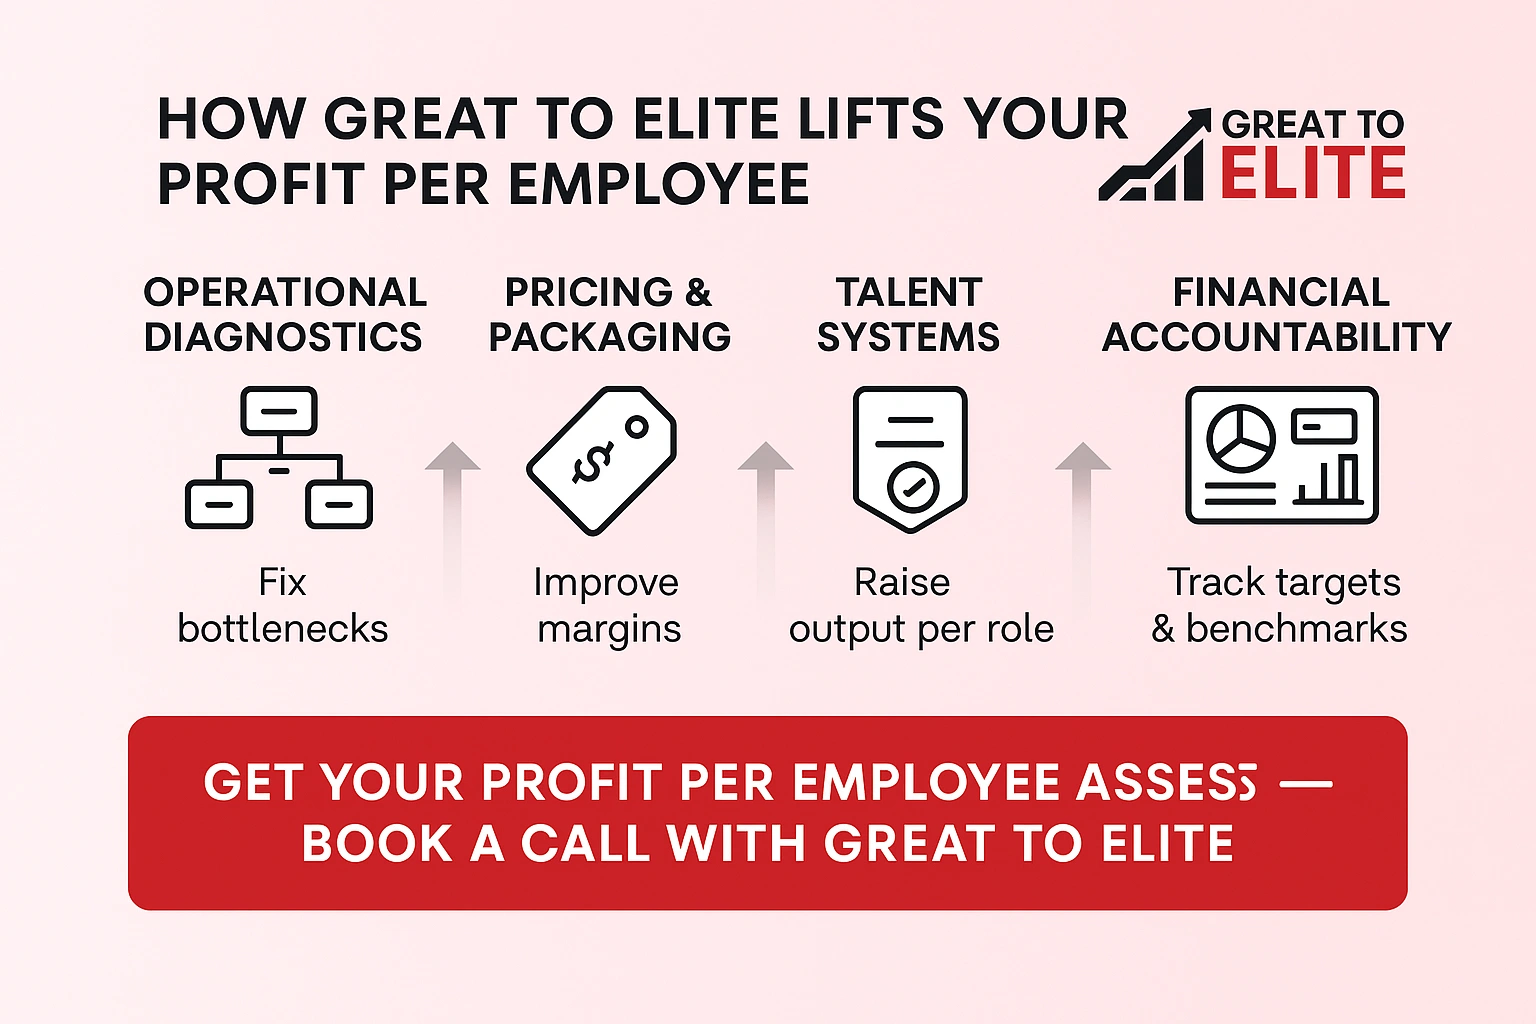
How Great to Elite Helps Service Businesses Lift Profit per Employee
Great to Elite helps service firms convert operational friction into measurable financial gains. You get a systems-first partner that focuses on practical changes you can measure against sector benchmarks.
What you receive is a focused program that raises efficiency and revenue while protecting your workforce and customer outcomes.
Operational diagnostics: Identify bottlenecks in workflows, handoffs, and utilization so you boost throughput without adding headcount.
Pricing and packaging: Engineer margin-focused offers that raise income per job and optimize cash flow.
Talent systems: Role scorecards, performance management, and training paths that raise output per person.
Automation and tooling: Lightweight tech to remove repetitive tasks and speed decisions with data.
Financial accountability: Targets and dashboards for profit per employee, revenue per employee, and sector comparisons.
You align leadership, ops, and finance so each initiative moves your company’s position versus peers within one to two planning cycles. Ready to lift this metric? Book a call with Great to Elite to assess your baseline, prioritize levers, and build a plan.
Conclusion
Use the calculation as an operational compass to align leaders and spot durable gains across the year.
You now have a clear, repeatable method to calculate profit per employee and turn the number into practical steps for your company.
Balance revenue per with this retained income signal so you improve both throughput and margins. Benchmark against sector averages, but judge those lists in light of your operating model and energy constraints.
Prioritize sustainable moves: better processes, smarter pricing, and capability building across the workforce. Treat last year’s ranking shifts as signals, not absolutes, and watch for one-off gains or loss that mask risk.
Your next move: set a baseline this quarter, pick three focused levers, and review progress regularly so improvements compound and last.
FAQs
What is considered a “good” profit per employee benchmark across industries?
›
Profit per employee varies widely by sector. High-margin industries like software, consulting, and financial services often show much higher ratios than labor-intensive or asset-heavy sectors such as manufacturing, retail, or hospitality. A “good” benchmark is one that aligns with your industry peers, your business model, and your profit structure. Compare your number only against similar companies with similar cost bases to get a meaningful signal.
Should founders, owners, and contractors be included in the employee count?
›
Only include roles that materially contribute labor to the company. Founders and owners who take a salary should be included as employees, while founders who only receive dividends should not. Contractors can be included if they perform ongoing work comparable to employees, just convert their hours into FTEs. Consistency matters more than the choice itself.
How often should profit per employee be calculated?
›
Most companies measure it annually, but quarterly tracking can reveal early signals about efficiency changes, hiring impact, or margin shifts. Monthly reviews tend to be too noisy because profit fluctuates with billing cycles, seasonality, and cost timing.
Does headcount growth always lower profit per employee?
›
No. Headcount growth lowers the ratio only if new hires don’t contribute enough value or productivity to offset their cost. When onboarding, utilization, and pricing are well managed, hiring can increase profit per employee even as the team expands.
How should businesses account for seasonal or temporary workers?
›
Convert all intermittent or seasonal labor into FTEs based on hours worked during the measurement period. This prevents seasonal spikes from distorting the metric and gives a more realistic view of productivity.
When should a business not use profit per employee to guide decisions?
›
Avoid using this metric in isolation when working on roles that do not directly generate profit (such as compliance, safety, HR, or customer support). Reducing staff in these areas may raise the metric in the short term but damage long-term performance, morale, or regulatory standing. Use the ratio as context, not a standalone basis for downsizing or restructuring.