Fixed Cost vs Variable Cost: Understanding Costs in Service Businesses
Fixed Cost vs Variable Cost: Understanding Costs in Service Businesses

Natalie Luneva
November 22, 2025


Fixed costs are the expenses you pay no matter how many clients you serve, your core salaries, software subscriptions, insurance, rent, and the operational backbone that keeps the business running day to day. Variable costs rise and fall with service delivery, such as contractor hours, payment processing fees, consumables, travel, or project-specific tools.
For service businesses, fixed costs reveal your true baseline: the minimum you must cover before turning a profit. Variable costs show how much each project or client actually costs to deliver, shaping margins, staffing decisions, and capacity planning.
Service businesses need to understand exactly which costs stay the same each month and which rise with every job or hour worked. Clear classification helps leaders predict profit, set accurate prices, and avoid surprises when demand shifts. In many service businesses, overhead (largely fixed costs) makes up about 35% or less of total revenue. When you know how expenses behave as volume changes, you can plan capacity, protect margins, and scale with confidence.
Profitability hinges on which expenses scale with jobs or hours and which persist regardless of workload. When variable costs rise with production, margins shrink unless prices or efficiency improve.
High levels of steady obligations mean the company needs more revenue to break even. Spreading those obligations over more jobs creates economies of scale.
As production and sales grow, activity-linked expenses increase proportionally while total steady obligations stay the same. Per-unit burden of steady obligations falls as volume rises.
Practical examples: technicians, subcontractor fees, and transaction charges rise with volume; rent and annual insurance do not. Regular reviews of how expenses change with growth keep pricing and forecasting accurate.
Separating steady overhead from charges that rise with each job helps service teams run profitable operations. Clear labels make pricing, forecasting, and staff planning more accurate. Below we define the main types of expenses and show when mixed arrangements matter.
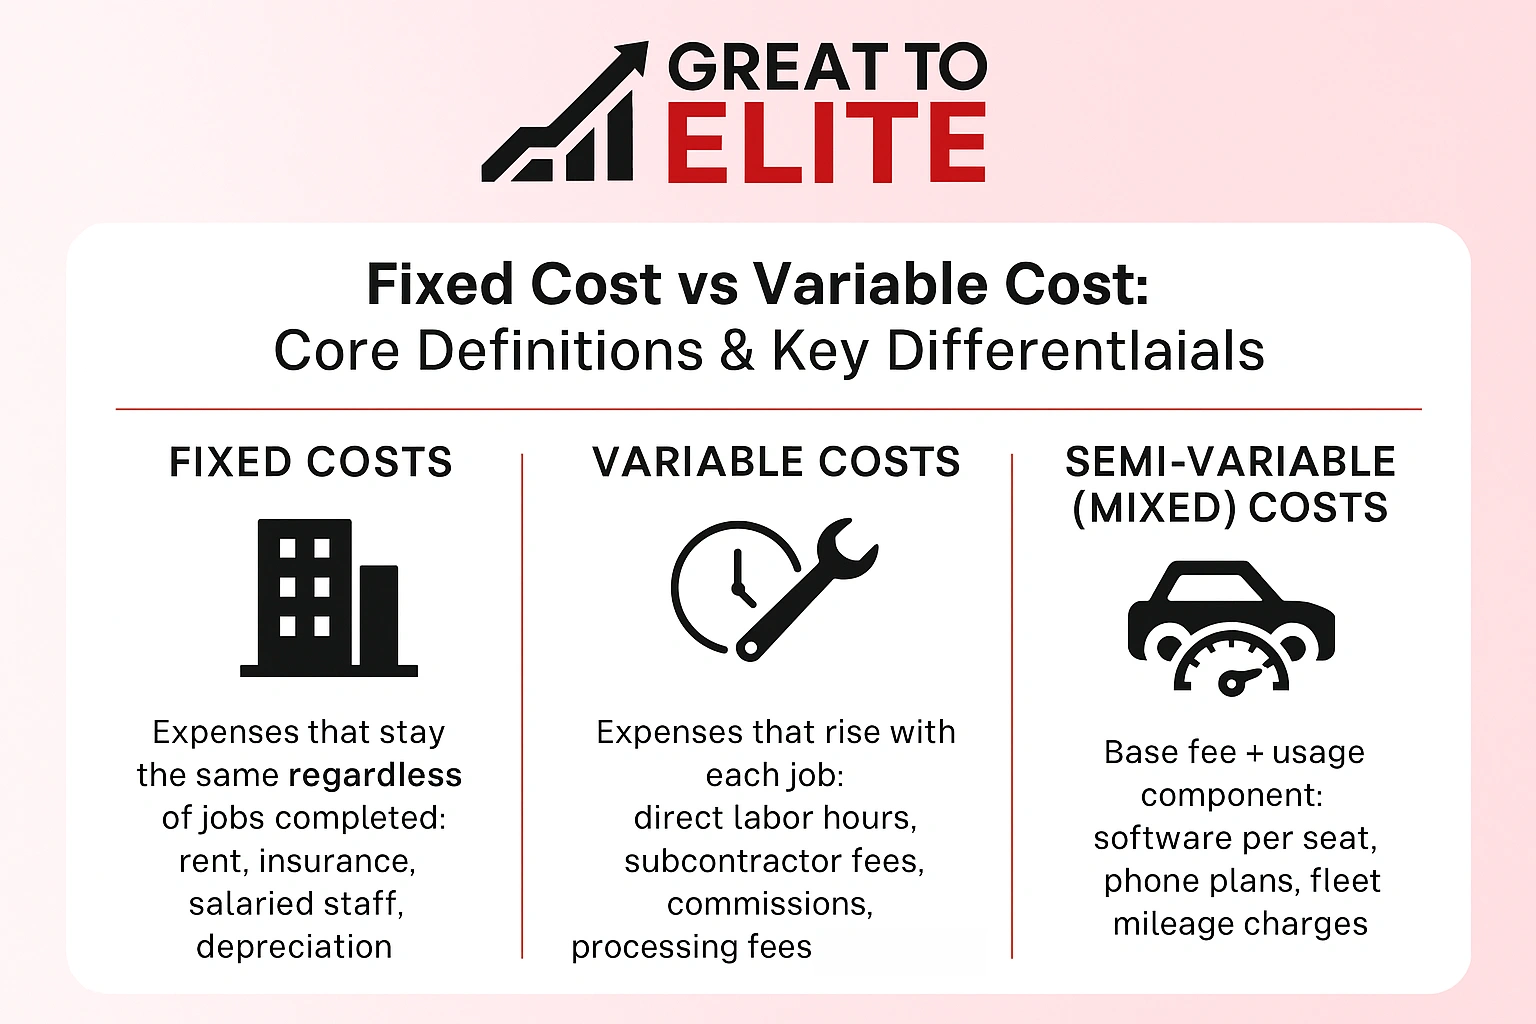
Fixed costs are obligations a company pays whether it serves one customer or one thousand. Examples include monthly rent for office or clinic space, annual insurance premiums, straight-line depreciation on equipment, certain salaried roles, and interest on loans.
Within a relevant range these totals stay the same, so per-unit burden falls as production volume rises. Not every fixed item is sunk, salable equipment can be converted to cash.
Variable costs move with activity. In services this often means direct labor hours per job, subcontractor fees, sales commissions, payment processing fees, consumables and raw materials used on calls.
The marginal cost to serve one more unit usually equals these incremental expenses and sets the minimum price for discounts or last-minute jobs.
Mixed lines combine a base fee plus usage charges. Examples include software subscriptions with per-seat pricing, phone plans with included minutes then overages, or fleet leases with mileage charges.
Service operators often see which expenses shift with every appointment and which remain monthly obligations.
Vehicle expenses often mix profiles: a lease payment can be steady, while mileage-based maintenance and fuel move with routes. Company policy on labor changes behavior too, hourly roles tend to rise with volume, salaried roles stay predictable within the planning horizon.
Takeaway: Capture these distinctions in your chart of accounts so reporting reflects real drivers of profit and helps managers make better operational decisions.
Knowing the true incremental expense of one more appointment helps managers make better decisions. Use straightforward per-unit math to link daily operations to profit targets.
Define the variable cost per unit for services as the sum of direct labor time per job multiplied by the wage rate, consumables or materials used, transaction fees, and other per-visit charges.
Spread steady obligations across projected volume to estimate the fixed cost per unit. For example, $60,000 in monthly rent, insurance, and salaried admin divided by 2,000 visits equals $30 per visit.
Doubling production while holding total steady obligations steady halves the allocated amount per unit inside capacity limits. Accounting should separate per-unit expenses from overhead so management sees true drivers of margin.
Managers need simple rules to translate job-level expenses into prices that protect profit. Start with contribution margin: price minus variable costs shows how much each sale contributes to covering overhead and profit.
Use contribution per unit to set minimum acceptable prices and to test discounts or promotions. Model prices at different volumes to see when margins meet targets.
Adopt zero-based or rolling budgets that separate period overhead from spend that rises with activity. This helps control expenses and lets managers tighten variable spending when demand shifts.
Adapt manufacturing logic: treat direct labor and materials per job as the “cost of services.” Record rent, insurance, and admin salaries as period overhead.
Model several production scenarios to test how price, mix, and volume changes affect margins and cash flow.
Finally, use accounting reports to track plan vs. actual for both overhead and per-job spend. Link KPIs like utilization and jobs per technician to financial results through contribution analysis to drive better management decisions.
Knowing the point where revenue equals total outlay helps managers set achievable targets. Break-even analysis links required sales to steady obligations and per-unit marginal spend. Use it to test pricing, promotions, and staffing decisions.
In words: divide total steady obligations by the contribution per unit (price minus per-unit spend). The result is the number of jobs or visits required to break even.
Example: price $120, per-job spend $60, steady obligations $60,000 → break-even = 60,000 / (120 - 60) = 1,000 jobs. Each job beyond that adds $60 toward profit.
As production volume rises, per-unit steady obligations fall while per-job spend rises proportionally. After break-even, margins improve if throughput and quality hold.
Reducing per-job spend starts with mapping workflows to find rework and idle time. Small fixes often cut labor minutes and materials without harming service quality.
Process, technology, and supplier strategies
When to trade labor for machinery
Run an ROI: compare one-time machinery and ongoing maintenance against expected labor savings at forecast production. Machinery often pays off in high-volume, low-volatility settings.
Governance and change management
Set approval thresholds for increasing steady commitments. Train teams, track before/after cost per job, and use dashboards to monitor consumables and fuel.
Misclassifying expenses skews prices and budgets and hides true profit per job. Small errors in labels make quotes and targets unreliable.
Watch hourly labor. In most service settings, it rises with production and should be treated as a variable cost for accurate contribution analysis.
Split mixed lines. Software subscriptions or utilities often have a base fee plus usage charges. Separate the two rather than lumping everything as overhead.
Update accounting when operations change. Converting hourly roles to salaries or automating tasks changes how expenses behave. Document rules in policy and run periodic audits after staffing or process changes.
Clean classification helps management decide pricing, quoting, and whether to accept low-margin work.
Service leaders win when they link daily operations to clear, measurable unit economics. Great to Elite builds a cost-driven operating system that separates steady overhead from per-job spend and aligns pricing to contribution margins.
Clear unit economics: variable costs per job and allocated overhead per period so your team prices services with confidence.
Contribution-based pricing playbooks: include transaction fees, labor time standards, and materials to protect margins at every volume.
Actionable budgeting: forecasts that tie monthly targets to break-even and profit goals, plus routines for supplier negotiation and process redesign.
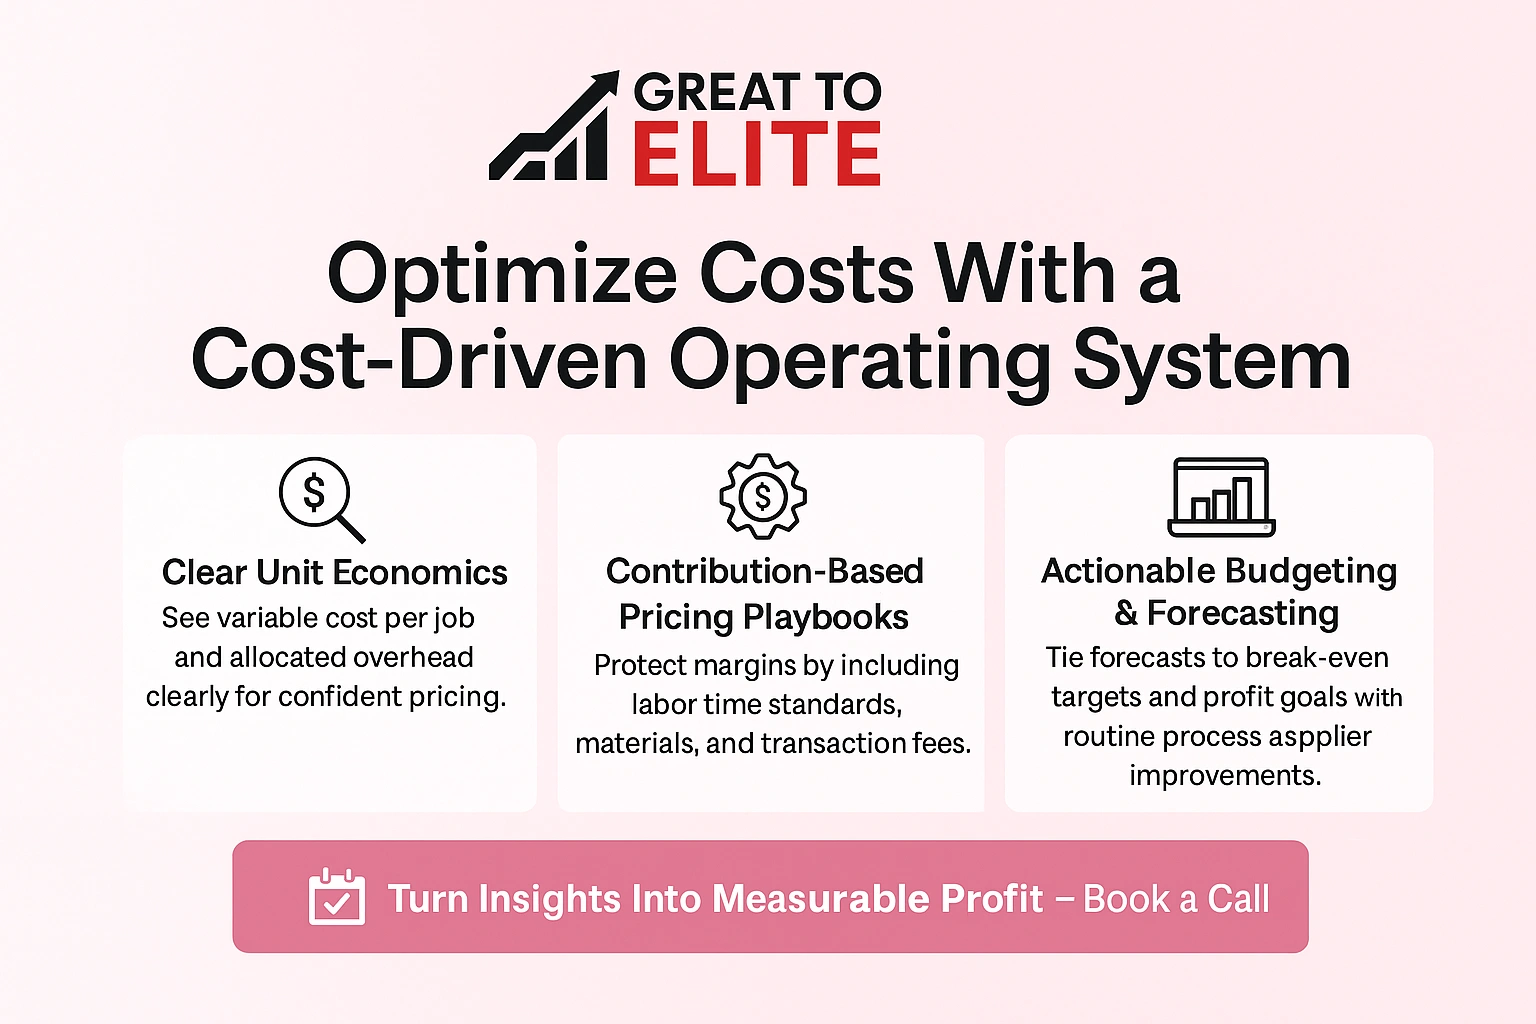
Great to Elite helps you prioritize initiatives, run indifference point analyses for capital choices, and build KPI dashboards for labor, materials, and revenue leakage. If you want to translate insights into measurable profit, book a call to assess your structure and create an executable roadmap.
Smart operators separate per-job spending from ongoing obligations to protect margins as volume changes.
In services, variable costs drop toward zero with no production, while fixed costs persist and must be spread across jobs. Model the cost per unit and the variable cost per job to set contribution-positive prices and realistic targets.
Use timely accounting to keep classifications correct and update assumptions as operations evolve. That prevents hidden margin erosion and helps the company react when sales or mix shift.
Watch examples fixed such as rent and insurance, and monitor payments and transaction fees as part of unit economics. Clarify your numbers, set contribution targets, and align pricing and operations to win profitable growth.
