Financial Benchmarking for Service Businesses
Financial Benchmarking for Service Businesses

Natalie Luneva
November 19, 2025


Financial benchmarking for service businesses is the process of comparing your financial performance, like margins, utilization, revenue per employee, and delivery costs, against industry standards or top-performing peers. It shows you exactly where you’re strong, where you’re falling behind, and what’s holding your profitability back.
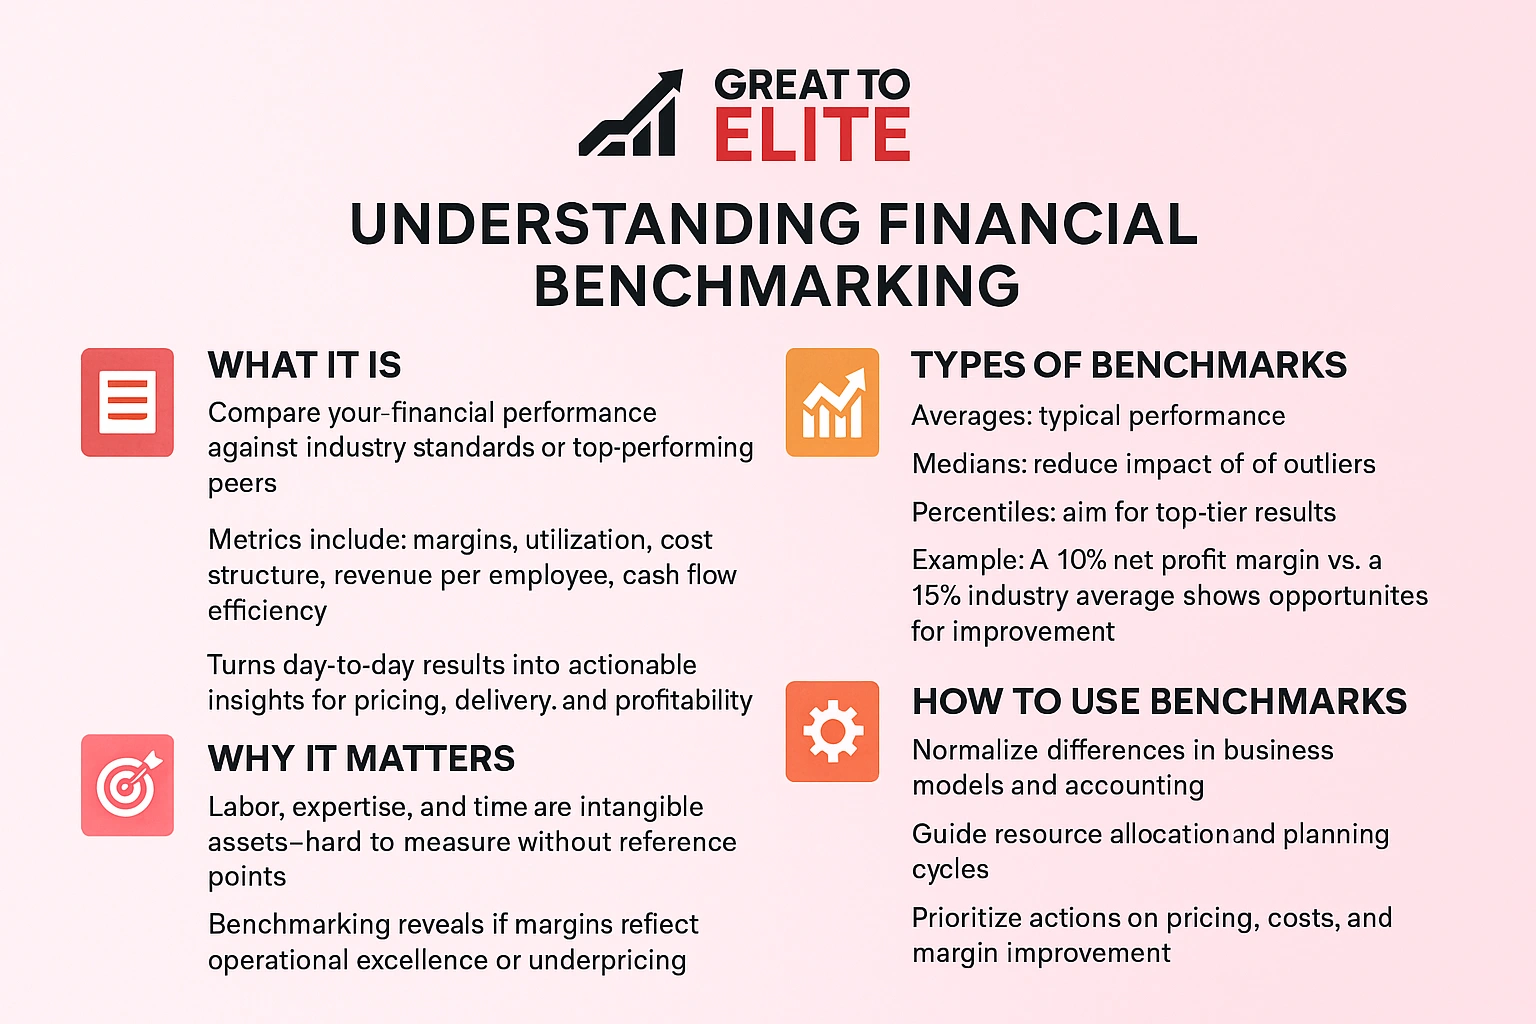
Financial benchmarking gives service businesses a clear, data-driven way to understand whether their performance is truly strong or just “good enough.” It’s the process of comparing your financial metrics, such as margins, utilization, cost structure, revenue per employee, and cash flow efficiency, against industry standards or top-performing peers. Instead of relying on gut instinct or scattered reports, benchmarking shows how your business stacks up, where you’re outperforming, and where hidden gaps are costing you money.
For service businesses, this matters even more. Your product is labor, expertise, and time, intangible assets that are harder to measure and even harder to optimize without the right reference points. Benchmarking turns your day-to-day performance into actionable insights, helping you evaluate pricing strength, delivery efficiency, and the true profitability of your service mix. It reveals whether your margins reflect operational excellence or simply underpricing, whether your overhead is healthy or bloated, and whether your team’s utilization aligns with top-quartile standards; currently, the average billable utilization rate for U.S. professional services firms is just under 69%, while the target rate is around 75%.
Benchmarks come from averages for typical performance, medians to reduce the effect of outliers, and percentiles when you aim for top-tier results. Choose the approach that matches your goal.
For example, a 10% net profit margin only becomes meaningful when you place it against a peer average like 15%. That gap helps you refine assumptions and set targets.
Good analysis depends on quality inputs. Use reliable data and apples-to-apples comparisons to cut noise and sharpen insights.
Turn gaps into prioritized actions on pricing, costs, and margin improvement.
How you compare results, broad sector vs. close peers, shapes the actions you take next.
Industry benchmarking gives big-picture context. Use it to spot trends across a market, understand valuation drivers, and set broad standards for margins and growth.
Peer benchmarking narrows the view. It focuses on similar companies so you get tactical insights on pricing, cost structure, and operational execution.
Pick peers that match your business traits: geography, service mix, customer type, and channel. Then align financial traits: revenue scale, revenue leakage, growth path, margin profile, seasonality, and leverage.
Anticipate differences from strategy or accounting and plan normalizations in your later analysis. That makes your comparisons clearer and your improvement plans more actionable.
Focus on a short list of metrics that translate raw numbers into actionable steps for profit and cash health.
Gross margin = (Revenue − COGS) / Revenue. Use this to test pricing and delivery efficiency. Investigate labor, vendor rates, and service mix when margin slips.
Net profit margin = Net Profit / Revenue. This shows end-to-end profit after overhead, interest, and taxes. Tie gaps to controllable levers.
Operating expense ratio = Operating Expenses / Revenue. Track SG&A to find cost savings without hurting client experience.
Asset turnover = Revenue / Total Assets. Use it to see if equipment, software, and working capital drive revenue efficiently.
Current ratio = Current Assets / Current Liabilities. Quick ratio = (Current Assets − Inventory) / Current Liabilities. Both protect day-to-day solvency.
Debt-to-equity = Total Liabilities / Shareholders’ Equity. Interest coverage = EBIT / Interest Expense. Set guardrails so debt doesn’t harm financial health.
Revenue growth rate compares current vs prior period. EPS growth = Net Income / Shares. Use both to match company trajectory to industry standards and investor expectations.
Action tip: Pair each ratio with peer quartiles or sector norms to set realistic targets and prioritize fixes.
Narrow the competitive set so every comparison you make is relevant and repeatable.
Define your scope: segment peers by size, service mix, client type, and geography.
List direct competitors and a secondary set of companies that show sector norms.
Use audited statements and public filings: SEC 10‑Ks, SEDAR+, and Companies House for consistency.
Supplement with reputable industry reports and surveys to fill gaps and validate trends.
Centralize sources in one analysis environment, standardize definitions, and tag every record for traceability.
Compute core ratios and trend them over multiple periods before you compare to peer and sector benchmarks.
Translate gaps into actions, assign owners, set timelines, and align decisions with budget and capacity.
Run quarterly deep dives and monthly KPI checks to keep your work current and actionable.
When data is sparse or inconsistent, your comparisons can mislead as much as they inform. You must treat inputs and methods as part of the result, not just the raw numbers.
Private companies often limit disclosure. Triangulate using filings, industry reports, and credible databases. Flag confidence levels for each input so stakeholders know which numbers are estimates.
Standardize statements into ratios and strip one-time items. Adjust for seasonality and capitalization policies to make true like-for-like comparisons.
Document key accounting differences, especially depreciation and revenue recognition. Convert or normalize items where feasible and note residual differences in an issues log.
Segment peers by region, customer type, and service mix. That prevents local market swings from masking company-level health or risk.
Set a refresh schedule and clear data ownership. Regular updates keep your analysis decision-ready and reduce stale assumptions.
Read metric families together, pair margin trends with turnover and leverage. Use holistic analysis to find root causes instead of chasing single-number fixes.
Concrete examples turn ratios into clear steps you can act on. Below are focused scenarios that link signal, likely cause, and practical fixes so you can make faster decisions.
If revenue rises but net profit lags peers, look beyond top-line wins. Check your operating expense ratio, pricing, and service mix.
Action: Tighten discount rules, review headcount plans, and test price increases on non‑sensitive segments.
Low receivables turnover signals slow collections and higher cash needs. Low inventory turnover points to overstocking or poor demand forecasting.
Action: Shorten payment terms, enforce credit limits, and align purchasing to rolling forecasts.
High debt-to-equity or falling interest coverage raises solvency risk. Coverage below peers means less room for shocks.
Action: Refinance costly loans, cut discretionary spend, or set covenants-based targets to reduce risk.
Compare your growth to market averages to see if gains are from category expansion or share capture. True progress shows up as outperforming the market plus improving margins.
Action: Split growth by client cohort and price bands to test sustainability.
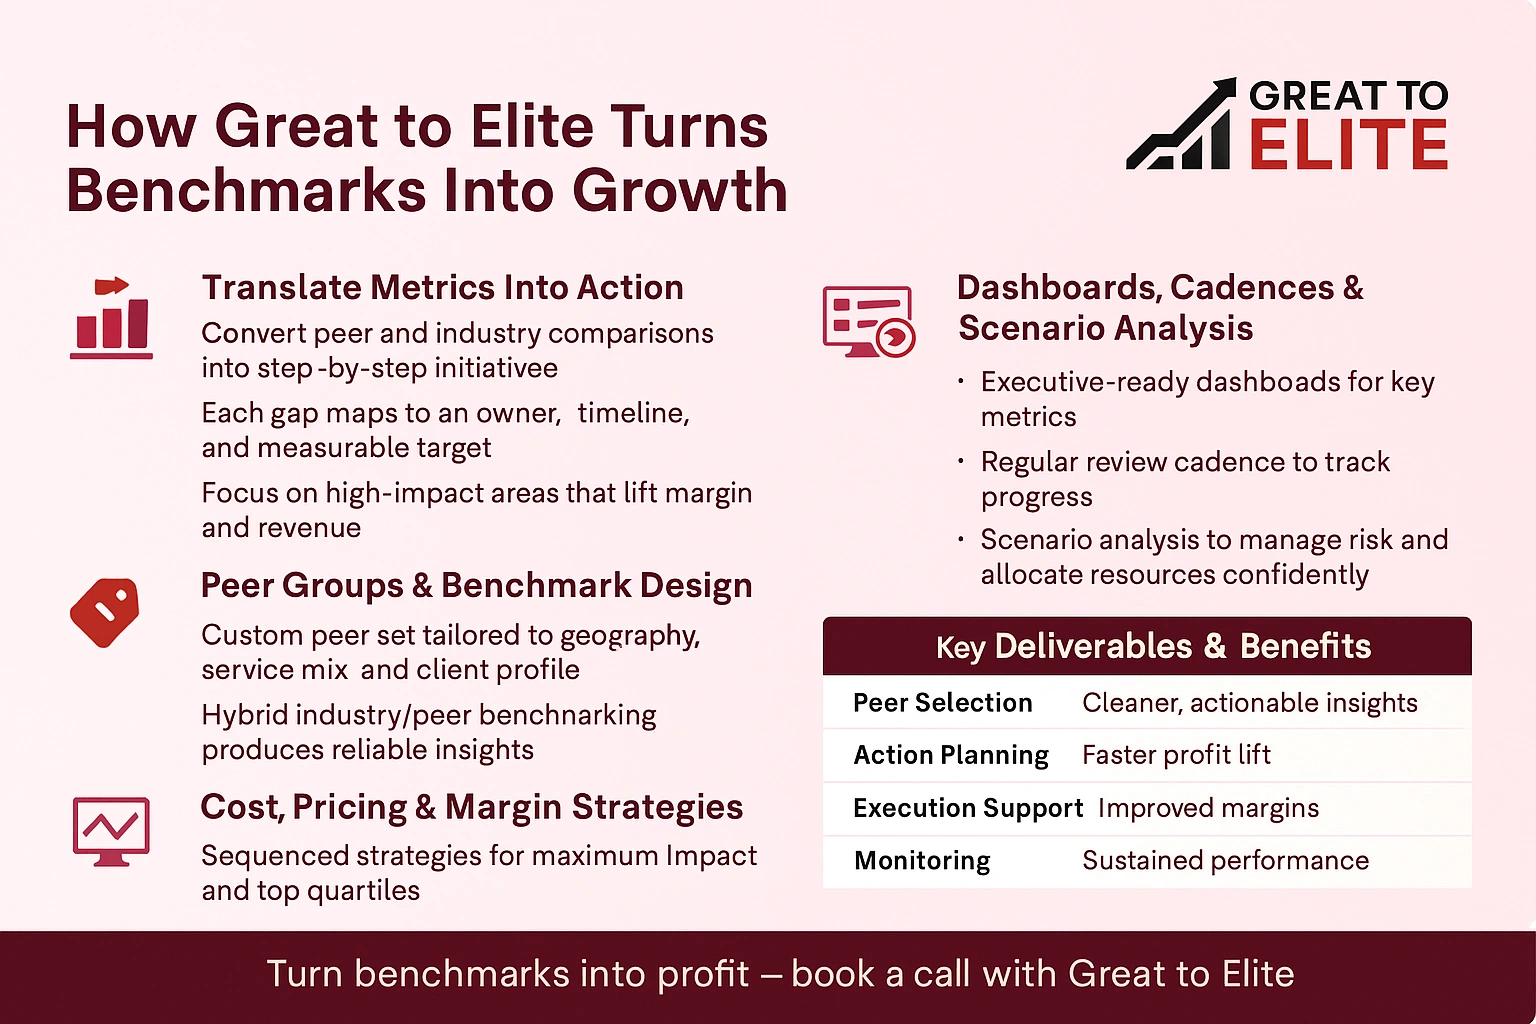
You need more than numbers, you need clear, prioritized plans that your team can execute. Great to Elite turns peer and industry comparisons into step-by-step actions. Each gap maps to an owner, timeline, and measurable target so progress is visible.
We convert ratios and model outputs into a short list of initiatives focused on high-impact areas. That keeps your team focused on the work that lifts margin and revenue.
Strong peer selection and a hybrid industry/peer approach produce reliable insights for valuation and performance. You get a custom peer set matched to geography, service mix, and client profile.
Strategies are sequenced for impact and feasibility. You receive measurable targets tied to peer medians and top quartiles to drive real profit improvement.
Ready to turn benchmarks into profit? Book a call with Great to Elite to tailor your benchmarks, prioritize actions, and build the cadence that sustains results.
A concise playbook helps you move from raw ratios to measurable improvement.
Use financial benchmarking and clear comparisons to align planning with market reality. Pair industry context with peer-level precision so your company sees true relative performance.
Prioritize trusted data, normalize for accounting differences, and keep a regular refresh cadence. That reduces noise and makes metrics actionable when you translate gaps into targeted cost and growth initiatives.
You now have a framework to benchmark profitability, efficiency, liquidity, leverage, and growth. Use this guide to align teams, protect client experience, tighten costs where needed, and track progress through dashboards and reviews to sustain performance.
