Cost-Value-Profit Analysis for Trade Businesses
Cost-Value-Profit Analysis for Trade Businesses

Natalie Luneva
November 14, 2025


A Cost-Value-Profit (CVP) Analysis is a financial framework that measures exactly how a trade business’s costs, revenue, and profit interact, providing a clear picture of the financial impact of every job or project.
It calculates how much each service contributes toward covering fixed costs, how variable expenses like materials or labor affect earnings, and the point at which a business breaks even and starts generating profit.
For trade businesses, this analysis goes beyond simple bookkeeping, it translates complex financial data into actionable insights, showing which projects are most profitable, how pricing adjustments affect income, and where inefficiencies in cost management can erode margins.
A Cost-Value-Profit (CVP) Analysis is a financial assessment tool used by trade businesses to evaluate how their costs, revenue, and profits interact under different business scenarios. It measures the relationship between the expenses of delivering a service or completing a project, the income generated from that work, and the resulting profit, allowing business owners to see exactly how each element affects the bottom line.
In practical terms, CVP analysis calculates how many jobs or projects a business must complete to cover all its costs, how changes in pricing or materials impact profitability, and which services contribute most to overall earnings. It quantifies the effect of cost changes, sales volume, and pricing on profit, and provides a clear picture of financial performance, helping trade businesses make data-driven decisions about pricing, resource allocation, and profitable growth strategies.
CVP turns complex financial interactions into a clear framework that shows how every dollar spent and earned influences profit, giving business owners a practical way to manage risk, plan for sustainable growth, and optimize cash flow.
For trade firms facing swings in demand, practical models reveal which decisions move the needle. CVP is a fast way to link sales, volume, and costs to real outcomes. The framework focuses on contribution margin, break-even point, margin of safety, and operating leverage so you can act with clarity.
With about 60% of small construction and trade businesses failing due to poor financial planning and mismanaged costs, a structured approach protects the margin and reduces risk. CVP analysis clarifies how shifts in sales volume change your bottom line and where you’re most exposed.
As you add crews or expand routes, CVP shows how fixed costs and capacity choices affect outcomes. Use these insights to align management decisions, scheduling, overtime, and subcontracting with measurable company targets.
Clarify the building blocks before you model outcomes. A tight setup keeps your results practical and actionable for crews, schedulers, and managers.
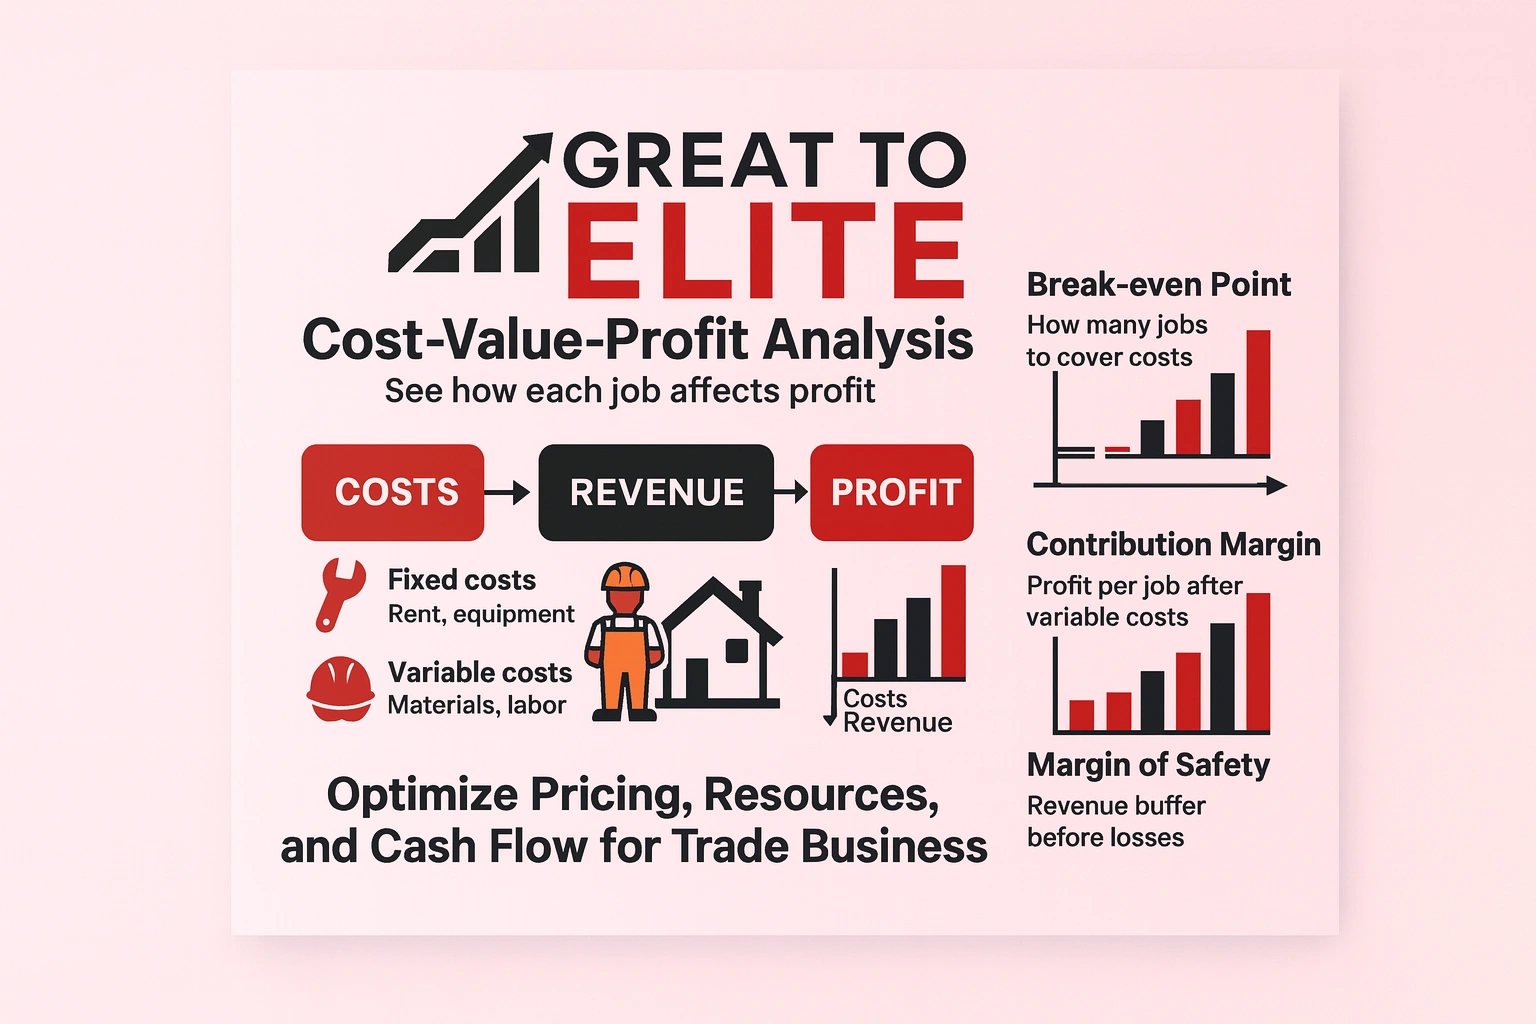
Fixed costs are the items that do not change with output. List shop rent, salaried supervisors, insurance, and software so your company can total them confidently.
Variable costs move with each job. Identify materials, hourly labor, fuel, and disposal fees to state a realistic variable cost per unit or per job.
Calculate your contribution margin per unit as selling price minus variable cost per unit. That contribution covers fixed costs and then becomes profit.
Compute the ratio by dividing contribution margin by sales. This helps you compare products and services with different prices and units.
Turn accurate job and sales records into a simple, usable model for daily decisions.
Gather a representative period of your sales by service line, jobs completed, and variable expenses per unit.
Verify totals against invoices, timesheets, and payroll so the numbers match field reality.
Record total fixed costs separately; that number anchors the break-even point and targets.
Build a contribution margin per unit for each service: selling price minus variable cost per unit.
Use this quick formula check: Profit = (CM per unit × number of units) − fixed costs.
Apply what-if checks: raise material costs by 10% or test a small price change and note how many extra jobs you need.
Document the steps so estimators, schedulers, and management make aligned decisions that support your targets.
Start with simple formulas that translate daily job numbers into clear revenue targets. These give you a quick view of the break-even point in both units and dollars, and they work for single services or mixed lines.
Compute break-even units as total fixed costs divided by contribution margin per unit. Multiply those units by selling price to get break-even sales dollars.
Margin of safety equals actual sales minus break-even sales. Convert it to a percentage and divide by actual sales to see how much revenue can fall before you reach the point of no gain.
Degree of operating leverage (DOL) shows sensitivity: contribution divided by net income. A higher DOL means small changes in sales produce larger swings in net results.
Turn CVP findings into concrete steps that change daily scheduling, quoting, and purchase choices. Use scenario tests to see how small price or material changes shift your contribution and required volume.
Run what-if scenarios on raw material spikes or a 10% sales decline. Note which inputs move your margin most, selling price, variable unit cost, or sales volume, and set trigger points for action.
Build simple rules: if materials rise X%, raise prices Y% or adjust procurement. Track weekly sales volume to spot trends before they hit cash flow.
When services compete for limited crew hours, rank them by contribution per labor hour. Prioritize jobs that give the highest contribution per constrained resource.
Calculate a weighted contribution-to-sales ratio for mixed lines so break-even estimates reflect your real mix. Revisit that mix monthly; shifts change your break-even and expose the company to risk.
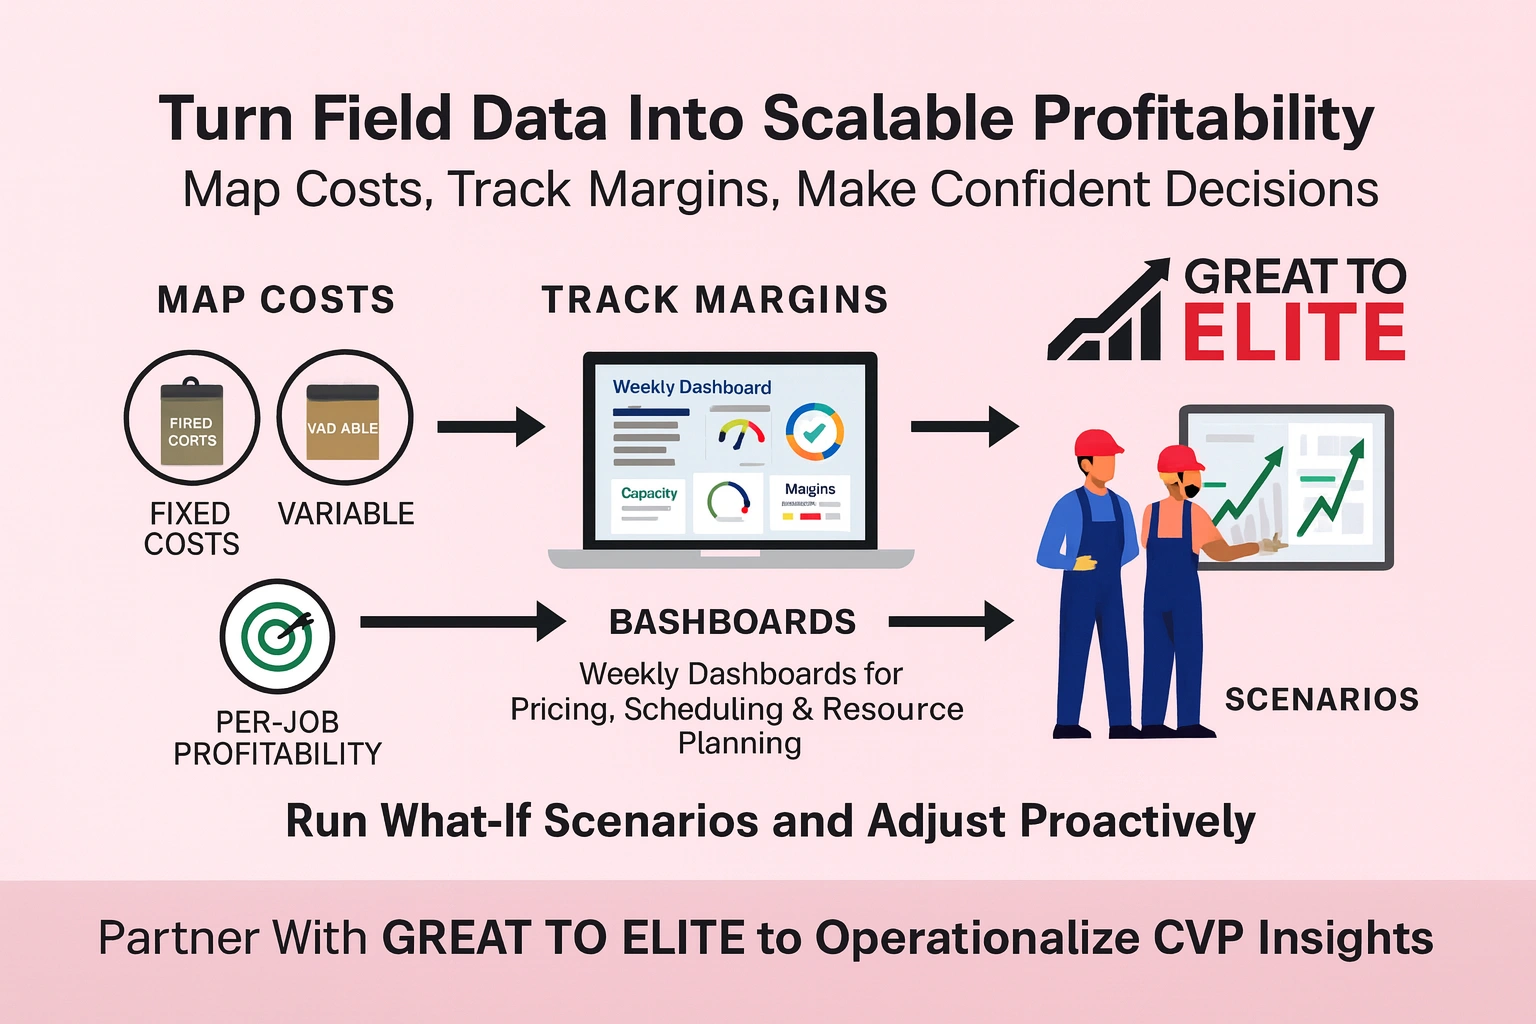
Make CVP the engine that converts field data into repeatable operating choices for growth. At Great to Elite, we help you move from spreadsheets to weekly dashboards, so decisions on crews, routes, and purchases follow clear numbers.
We map fixed costs and variable costs to each service and set target contribution margin per service. That lets you price, sell, and schedule with consistent outcomes.
Our coaching trains your team to run what-if scenarios and sensitivity checks. You’ll adjust price or volume proactively, not after month-end.
Great to Elite embeds CVP into operations. Management gets weekly signals that link sales, capacity, and margin so leaders act fast and stay aligned.
If you’re ready to elevate profitability with clarity and control, contact Great to Elite to put CVP to work in your operation.
End with a plan: use simple, repeatable checks to keep your operations aligned with financial goals.
Run quick checks on contribution margin and the break-even point each period. Refresh sales, variable cost, and total fixed costs so the model tracks real field data.
Use the equation or contribution methods to compute required units and sales, then monitor those units weekly. Keep assumptions, linear relationships and a stable sales mix, front of mind and update them as products or production levels change.
Protect your margin and watch expenses and prices closely. With disciplined CVP work, you’ll reduce risk and make faster decisions. Partner with Great to Elite to turn these checks into dashboards and routines that your company can follow every week.
