Budgeting and forecasting mean setting a clear financial plan and predicting what’s likely to happen based on real data. Budgeting defines how much you’ll spend, earn, and allocate across your operations. Forecasting shows where your revenue, costs, and capacity are heading so you can adjust before problems appear.
For service businesses, this is important because your revenue depends on people, time, and project flow. Shifts in client demand, staffing levels, billable hours, or utilization can quickly impact profitability. Strong budgeting and forecasting help you stay ahead, optimize cash flow, plan capacity, and make confident decisions rooted in reality rather than guesswork.
Key Takeaways
You’ll get a roadmap to run your service business with intention, not guesswork.
Map projected revenue and expenses to goals so your budget becomes an active baseline.
Rolling forecasts, updated with current data, let you react faster to client demand shifts.
Budgets anchor annual planning; forecasts keep you aligned as conditions evolve.
Translate targets into actions across delivery, staffing, and overhead for better performance.
Why Financial Planning Matters for Service Businesses
A reliable planning rhythm gives you the visibility to act fast and with confidence. Financial planning links strategy to daily work so your teams know which actions move the needle.
Use a structured approach: set annual targets, assemble departmental plans, then update after month-end or quarter-end closes. Those post-close cycles supply current data that improve your decisions and reduce surprises in utilization and margins.
Anchor goals to clear processes so teams have accountable tasks to hit targets.
Run monthly or quarterly updates to get timely insights and course-correct mid-period.
Turn raw numbers into guidance that improves delivery capacity and client outcomes.
Cadence
Owner
Primary Outcome
Annual plan
Finance lead
Strategic goals and resource alignment
Monthly post-close
FP&A team
Current performance visibility
Quarterly review
Department heads
Cross-functional adjustments
Rolling updates
Program managers
Reduced surprises in delivery
When conditions shift, these routines keep your finance work usable and current. Great to Elite helps teams set the right cadence so the plan stays relevant and actionable for your business.
Definitions And Core Concepts
Knowing which numbers are plans versus predictions keeps operations focused and responsive.
What budgeting covers: revenue, expenses, and cash allocation
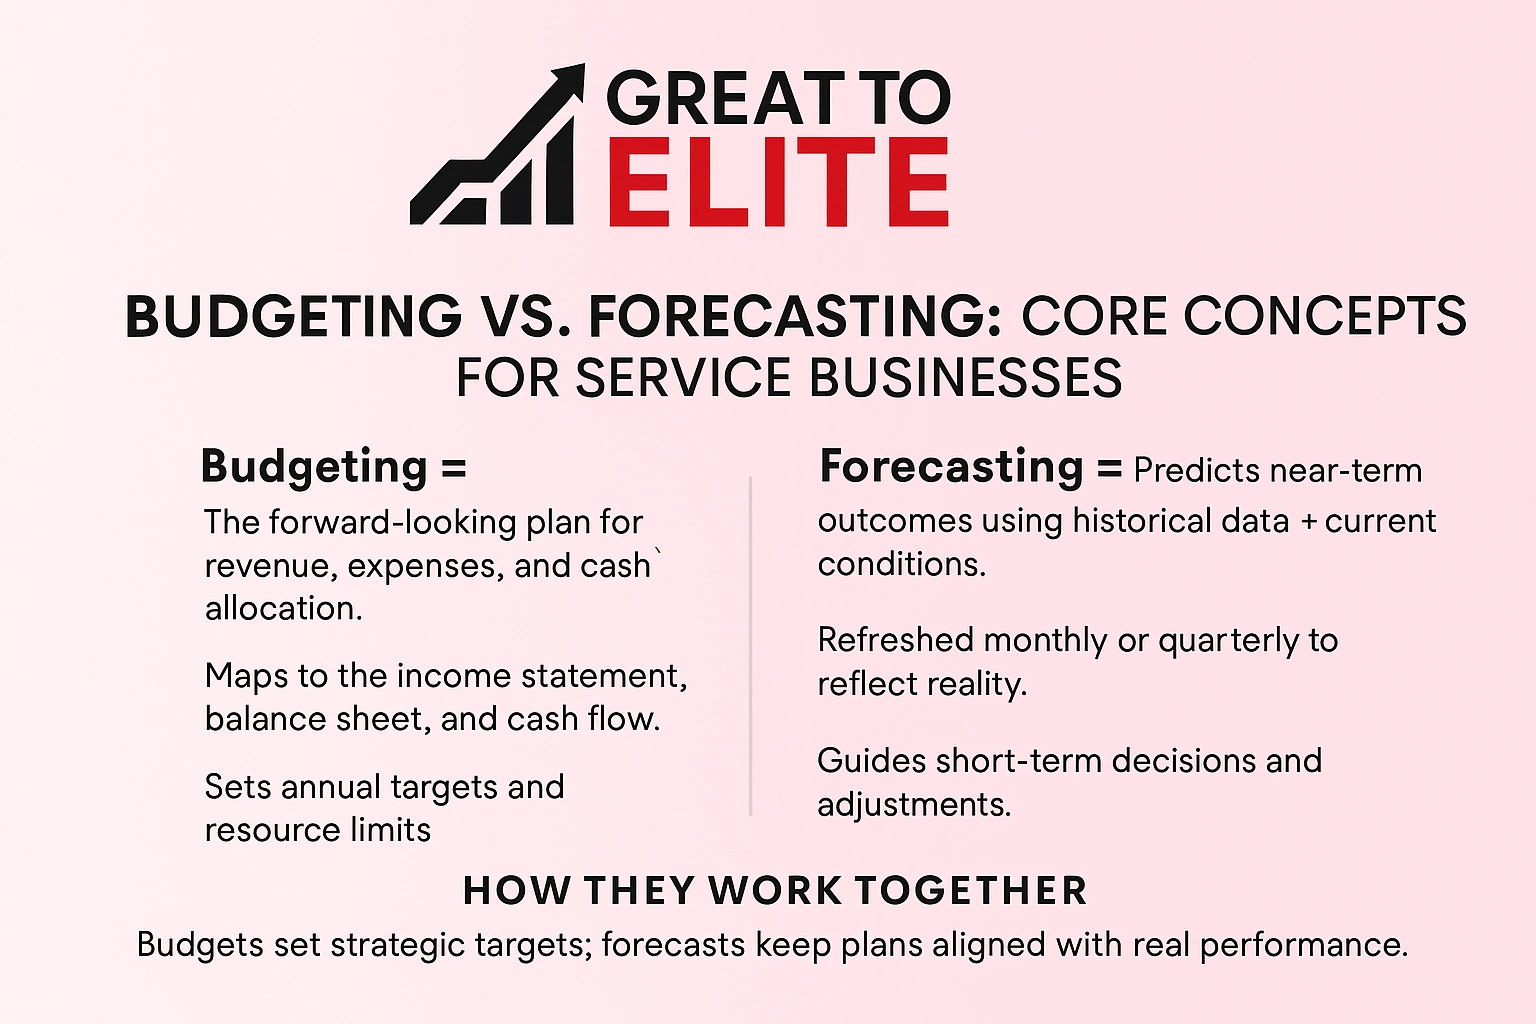
You define budgeting as the forward-looking plan for revenue, expense, and cash allocation that underpins your operating model.
It maps to the income statement, balance sheet, and cash flow so teams see how targets translate to resources.
What forecasting predicts: outcomes from historical data and current conditions
Forecasting uses historical data plus current inputs to predict near-term outcomes. You refresh these often to reflect reality.
How plans and projections align with organizational goals
Budgets translate strategy into numbers; forecasts keep those numbers aligned with reality. Regular variance analysis shows when to change spending, pricing, or staff levels.
Goals cascade from the organization into department targets.
Assumptions and data sources shape accuracy for both processes.
Clear roles avoid confusion between targets and expected results.
Budgeting Fundamentals For Services
Map the sources of income and the types of expenses you expect over the coming fiscal year. List expected revenue streams, then group costs into fixed, variable, and one-time items so nothing gets missed.
Key Components: Estimated Revenue, Fixed And Variable Costs, One-Time Expenses
Estimate revenue from utilization, bill rates, and delivery capacity for each period. Break costs into fixed items like rent and salaries, variable costs tied to delivery, and one-time project spending.
Cash Flow Statements And Fiscal Year Planning
Link your cash flow statement to daily operations and longer-term capital needs. Use it to check timing gaps between client receipts and payroll or supplier payments.
Common Budget Types: Operating, Financial, Cash Flow, Static, Master
Choose the right format for the job: operating for operations, cash flow for liquidity, financial for capital planning, static for control, and master to consolidate all views.
Structure submissions by department on a clear timeline using consistent data.
Set expense policies to protect service quality while controlling spending.
Install management checkpoints for variance reviews and audit-ready documentation.
Type
Use
Primary Focus
Operating
Run the business
Revenue, expense control
Cash flow
Protect liquidity
Timing of receipts/payments
Master
Consolidate plans
Resource allocation
Forecasting Fundamentals For Services
A rolling outlook helps your team act quickly when client needs change. Keep cycles short so projections stay rooted in what you just closed. Update after each month-end or quarter-end so your plan mirrors reality, as 75% of companies that use predictive cash forecasting report improved cash flow visibility.
Rolling Timeframes: Monthly and Quarterly Updates
Set a clear cadence: monthly for fast-moving delivery, quarterly for broader resource moves. Shorter periods reduce lag and make each update actionable.
Qualitative, Quantitative, and Causal Approaches
Pick the method that fits your inputs. Use qualitative judgment when you lack history. Use quantitative trend models when you have stable series of data. Use causal models when drivers are measurable and linked to outcomes.
Updating KPIs After Close
Close the books, then refresh KPIs like utilization, pipeline conversion, and margin. Use historical data to test assumptions. Run simple accuracy analysis to improve future updates.
Align time horizons across ops and finance so updates drive hiring, scheduling, and pricing.
Document inputs so each period’s process is repeatable and fast.
Turn insight into action, shift capacity, reprioritize work, or adjust spend when the forecast shows risk.
Method
Best Use
Data Needs
Cadence
Qualitative
New services or limited history
Expert judgment, market signals
Monthly/Quarterly
Quantitative
Stable trends and repetitive delivery
Time series, historical data
Monthly
Causal
Driver-led decisions (pricing, headcount)
Regression inputs, transactional data
Quarterly
Combined
Complex operations
Blended datasets and analysis
Monthly/Quarterly
Budgeting And Forecasting: Key Differences You Should Know
Different time horizons drive different actions in a service organization. Use this guide to separate long-range targets from short-term signals so you can act with confidence.
Timeframe, flexibility, and reliability
Budgets set annual guardrails for strategy, staffing, and resource allocation. They often lock in assumptions that weaken as the year progresses.
Forecasts refresh frequently with current inputs. That makes them more reliable for near-term decisions and course corrections.
Best uses: strategy versus short-term decisions
Budgets guide strategic planning, capital choices, and formal approvals across the organization.
Use variance analysis to decide whether to change the approved budget, update the forecast, or alter operations.
Assign clear owners: long-range plan owners for the budget and frequent-update owners for the forecast.
Aspect
Budget
Forecast
Primary use
Strategic targets
Near-term decisions
Cadence
Annual
Monthly/Quarterly
Flexibility
Low after approval
High; adapts with data
Reliability over time
Declines as assumptions age
Improves with fresh inputs
Why Your Business Needs Both
A clear plan plus frequent updates help your firm turn targets into timely action.
Your annual budget gives your organization goals, resource limits, and longer-term direction. It sets priorities for staffing, delivery capacity, and investments so leaders can agree on trade-offs.
Regular forecasting keeps that plan useful when conditions shift. When you refresh projections with current data, your teams spot trends early and adjust work, hiring, or marketing to protect outcomes.
You’ll see how a budget anchors goal-setting while forecasts inject agility so you can navigate change confidently.
Combining both improves resource prioritization and keeps delivery, marketing, and staffing aligned across the organization.
Build simple review rhythms where teams compare performance to targets, use data to evaluate trade-offs, and act fast.
Reduce surprises in cash needs and resourcing because periodic updates reflect real conditions and improve decisions.
Bottom line: treat the budget as your roadmap and frequent projections as the steering wheel. Together they sharpen finance credibility, limit silos, and make each planning cycle more valuable.
Benefits Of Combining Budgets And Forecasts
Combining a clear plan with frequent updates gives service leaders the tools to act before problems grow. This pairing turns raw numbers into timely guidance you can use in hiring, pricing, and delivery decisions.
Better Decisions, Cash Flow Control, And Accountability
You’ll make better decisions because updated projections reveal trends early while a formal budget sets acceptable ranges for action.
Stronger cash flow control follows when you align expected inflows and outflows with planned spending. That reduces surprises at payroll and vendor pay dates.
You’ll increase accountability as departments own targets and feed regular updates into a shared process. This tightens performance and clarifies who acts when variances appear.
You’ll improve performance if you use variance analysis to find issues fast and apply corrective measures.
You’ll unlock insights for leadership and investors through consistent, high-quality narratives tied to numbers.
You’ll streamline management reviews with clear budget-to-actual and forecast comparisons for quicker decisions.
Benefit
What It Shows
Who Benefits
Actionable Outcome
Early trend detection
Shifts in demand or utilization
Delivery teams, Sales
Adjust staffing and schedules
Cash alignment
Timing of receipts vs. payments
Finance, Management
Plan spend to avoid shortfalls
Clear accountability
Owned targets and update cadence
Department heads
Faster corrective steps
Investor-ready insights
Consistent narratives with numbers
Leadership, Investors
Stronger confidence and support
Data Practices: From Historical Data To A Single Source Of Truth
A single, trusted dataset turns slow review cycles into fast, actionable insight. Remove siloed files so you can trust reports at every review. Consolidation speeds month-end close and reduces time spent fixing numbers.
Map ERP, CRM, and HR sources to one standard structure. That makes inputs consistent across the organization and helps your teams move faster during planning cycles.
You’ll standardize sources so each dataset feeds the same model and your budget aligns across groups.
You’ll replace manual spreadsheet steps with integrated pipelines that cut cycle time and reduce errors in processes.
You’ll increase forecasting accuracy when you validate inputs and keep assumptions documented in one place.
You’ll add audit-ready controls: submissions, approvals, version history, and lightweight quality checks to catch anomalies early.
You’ll clarify ownership so teams know who curates each feed and how updates flow into planning.
Source
Provides
Owner
ERP
Actuals, invoices, cash
Finance
CRM
Pipeline, bookings, conversion
Sales
HR
Headcount, rollup cost
People Ops
Common Challenges And How To Overcome Them
Fragmented inputs create noise that hides true performance signals from leaders. Fixing that starts with simple control changes you can adopt this quarter.
Disconnected data and manual processes
Many finance teams still use offline spreadsheets. Version conflicts, slow merges, and limited compute hurt speed.
Remedy: centralize inputs, standardize templates, set a submission calendar. This cuts rework and shortens cycle time.
Workflows, audit trails, and validation
Missing workflows raise risk and reduce trust in numbers.
Remedy: add simple approval steps, automated validation rules, and a visible audit trail so management can trust reports fast.
Dealing with uncertainty and variability
Variable conditions demand scenario plans that show ranges, not single points.
Remedy: build three scenarios, run sensitivity analysis, then use the results to set flexible hiring or cash buffers.
Ensuring stakeholder buy-in and alignment
Engage cross-functional teams early. Train contributors on assumptions and definitions to keep analysis consistent across the organization.
Replace disconnected manual processes with structured workflows.
Implement audit trails plus validation to improve trust.
Use scenario plans to handle uncertainty in a practical way.
Issue
Action
Outcome
Spreadsheets
Standard template
Faster close
No audit trail
Approval workflow
Higher trust
High variance
Scenario planning
Clear ranges
Tools And Technology That Improve The Process
Modern planning tools let you move from manual collection to quick analysis with less effort.
Automating Data Integration And Real-Time Updates
You’ll connect systems so data flows into a shared model without repeated imports. This cuts errors and shrinks cycle time.
With near real-time updates, your projections refresh as bookings, invoices, or headcount change. That keeps plans usable between closes.
Scenario Modeling And Collaboration Workflows
Use scenario models to compare best, base, downside outcomes with clear assumptions. Side-by-side views help test trade-offs quickly.
Collaboration workflows route tasks, capture comments, and enforce approvals so teams stay aligned. Audit trails prove who changed what and when.
Automate data flows so updates land in models fast, reducing manual effort.
Refresh projections in near real time as conditions change.
Build scenarios to compare alternative paths with assumptions attached.
Use workflows to capture commentary, assign tasks, and lock approvals.
Centralize drivers so budgets and forecasts stay consistent across teams.
Feature
Benefit
Primary Users
Management Impact
Automated integration
Faster, cleaner data
Finance, Ops
Shorter close, better trust
Real-time updates
Timely insight
PMs, Sales
Faster course-corrects
Scenario modeling
Clear trade-offs
Leaders, FP&A
Stronger decisions
Workflows & audit trails
Accountability
All teams
Audit-ready reporting
Methods And Models That Drive Better Forecasts
Pick the modeling approach that matches your business goals and data quality. A clear choice at the start saves time during analysis and helps your team act with confidence.
Top-Down Versus Bottom-Up Approaches
Top-down uses market size, growth, and share targets to set high-level goals. Use it when you need quick sizing or when service metrics are immature.
Bottom-up builds from services, activities, headcount, and utilization. It gives precision for operations and hiring decisions.
Setting Baselines And Focusing On Key Metrics
Establish baselines using current revenue, expense, cash flow, profit, and margin data. Strong baselines make any forecast more defensible.
Focus on a few drivers: utilization, bill rate, pipeline conversion, and churn. These explain most short-term trends and performance shifts.
Variance Analysis To Refine Performance
Compare budget to actuals to spot gaps. Use root-cause analysis to decide corrective actions and improve future planning accuracy.
Choose top-down when you must size market opportunity fast; pick bottom-up for operational precision.
Combine qualitative judgment with quantitative signals when data are sparse or shifting.
Keep a clear link from forecast drivers to budget targets and set regular review cadences where finance presents proposed adjustments.
Approach
Best Use
Primary Input
Top-down
Market sizing, strategic targets
Market data, growth rates
Bottom-up
Operational planning, staffing
Service-level activity, utilization
Hybrid
Complex ops needing both views
Market signals plus delivery data
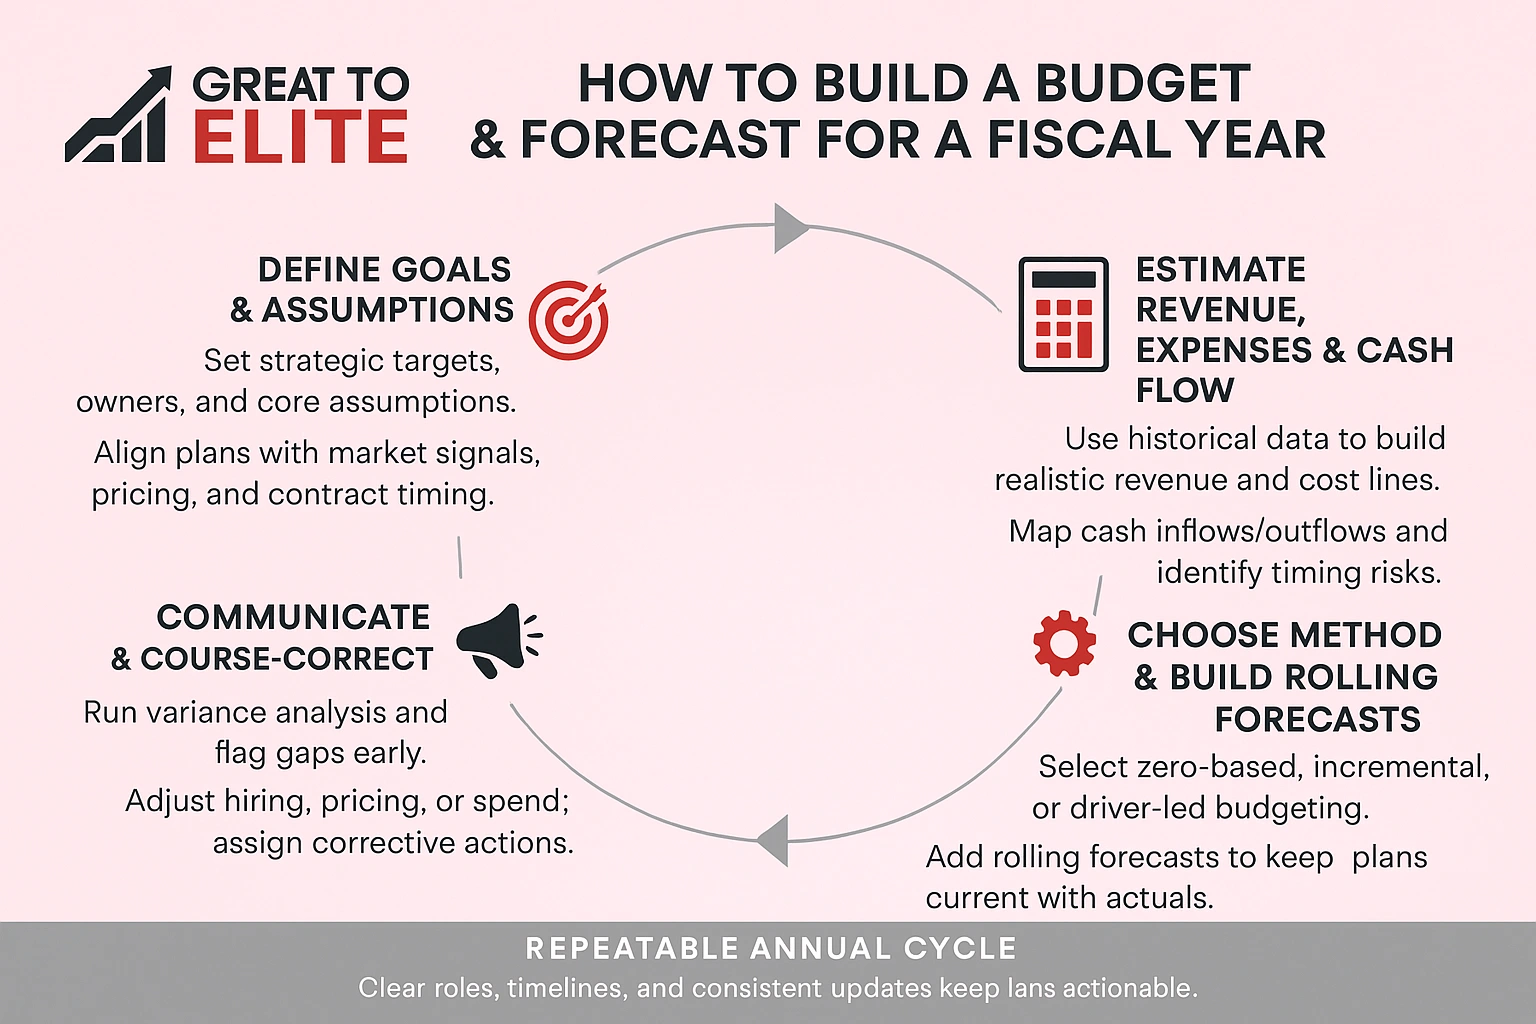
How to Build A Budget And Forecast For A Fiscal Year
Create a repeatable cycle that aligns finance, delivery, and leadership around clear targets and owners. Use the steps below as a checklist to convert strategy into numbers you can act on.
Define Goals and Assumptions
Docmument strategic goals and the core assumptions that drive them. State target outcomes, timing, and who owns each item.
Capture market signals, pricing moves, and contract timing so everyone plans from the same base.
Estimate Revenue, Expenses, and Cash Flow
Gather historical data to shape realistic revenue and expense lines. Translate delivery plans into periodized revenue by project or service.
Map inflows and outflows to see cash flow timing risks and build simple buffers where needed.
Select A Budgeting Method And Build Rolling Forecasts
Choose the method that fits your team, zero-based, incremental, or driver-led, and set a rolling projection horizon. Layer rolling forecasting on top of the approved budget so actuals update expectations.
Communicate Results And Course-Correct
Run regular variance analysis, highlight gaps, and recommend actions like hiring holds or repricing. Share concise reports with owners and delivery leads.
Document goals and core assumptions for all contributors.
Collect the right historical data to inform estimates.
Translate delivery plans into a practical budget by period.
Build rolling forecasts so plans stay current as actuals arrive.
Analyze variances and flag hiring, pricing, or spend adjustments.
Communicate results clearly and assign corrective tasks.
Formalize a repeatable process with roles and timelines.
KPIs, Trends, And Performance Metrics To Track
Define a concise KPI set that reflects how your services actually produce revenue. Use regular updates so your forecast refreshes key lines like period revenue, expense categories, and utilization.
Focus on service-centric measures:
Utilization, billable rate, backlog, gross margin, align each to your goals.
Use data to link pipeline and sales signals with capacity and delivery performance.
Set thresholds that trigger action when performance drifts from target ranges.
Validate historicals and peer benchmarks so metrics mirror your operating model.
Give teams clear dashboards with transparent KPIs so crews can manage toward targets during each period. Periodic analysis keeps metrics relevant as services evolve and helps you avoid over- or underspending, as it aligns budget targets with forecast ranges.
KPI
Purpose
Trigger
Utilization
Capacity planning
<85% sustained
Billable rate
Margin pressure
Drop >5% vs plan
Backlog
Revenue visibility
Decrease 2 months
Pipeline conversion
Sales health
Win rate falls 10%
Scenario Planning For Changing Market Conditions
Use scenario modeling to test how shifts in demand, rates, or staffing change your near-term plans. This method turns uncertainty into clear choices so your team can act when market signals change.
Modeling Best Case, Base Case, and Downside Cases
Start with three simple cases. For each, state assumptions for demand, win rates, pricing, and headcount. Keep each assumption short and measurable.
Build cases with explicit assumptions for demand, rates, and staffing.
Quantify outcomes, project revenue, improved margins, and delivery pressure for each path.
Compare to budgets and active forecasts to identify stress points and options.
Use data-driven analysis to craft contingency plans for sudden market shifts.
Define triggers (backlog drops, win-rate changes, pricing moves) that move you between scenarios.
Communicate impacts so leaders agree on actions before conditions change.
Case
Key Driver
Primary Outcome
Best
High demand, higher rates
Revenue uplift, margin expansion
Base
Stable pipeline
Plan-aligned delivery and cash
Downside
Lower wins, price pressure
Margin squeeze, staffing fixes
Monitoring, Reviews, And Continuous Updates
Keep a tight review rhythm so leaders see trends before they become problems. Set a clear period for reviews so your team treats planning as an ongoing activity, not a once-a-year task.
Monthly And Quarterly Cadence For Budgets And Forecasts
Run post-close refreshes after each month-end and quarter-end. That timing ensures your forecasts reflect the latest actuals and pipeline shifts.
Compare actuals to the approved budget using quick variance analysis. Assign owners for each gap so fixes happen fast and responsibility is clear.
Set monthly or quarterly reviews to keep plans aligned with reality.
Refresh source data on time so management makes decisions from current information.
Communicate changes quickly to preserve performance accountability across teams.
Use regular management forums to decide on spending changes or hiring actions.
Keep a living calendar for finance and business reviews to embed discipline in the cycle.
Cadence
Primary Action
Owner
Monthly
Update forecasts and refresh KPIs
FP&A
Quarterly
Review strategy, adjust budget ranges
Finance Lead
Ad hoc
Trigger scenario analysis on surprises
Department Heads
Outcome: a repeatable cycle where data flows in on time, analysis drives decisions, and ownership keeps performance on track.
How Great to Elite Helps Service Businesses Succeed
Your team needs planning that links goals to daily work; Great to Elite builds that bridge. We combine modern tools with practical processes so you can act from current numbers and confident assumptions.
Partnering With You To Elevate Planning, Analysis, And Outcomes
Strategic Planning Enablement: Align goals, translate them into budget targets, and set a rolling forecasting cadence tailored to your services model.
Operating Model Design: Map drivers, utilization, rates, pipeline, delivery capacity, into models that produce actionable insights for your teams.
Data Foundation: Consolidate ERP, CRM, and HR into a single source of truth with validation, audit trails, and clear ownership to support finance accuracy.
Scenario Modeling: Build best, base, and downside cases so you can pivot quickly as market signals change.
Performance Management: Embed KPI dashboards, variance analysis, and review rhythms to keep execution on track.
Process and Controls: Implement workflows that streamline submissions, approvals, and cross-team collaboration across your organization.
Tooling Guidance: Advise on software choices and configuration so your processes scale with your needs.
Why it matters: Faster cycles, higher accuracy, and clearer accountability across finance and delivery help your business protect cash and improve performance. Decisions become timelier because they rest on current data and transparent assumptions.
Ready to strengthen your planning, resource alignment, and outcomes? Book a call with Great to Elite to discuss your needs and build a roadmap for your business.
Conclusion
End the fiscal year with a simple playbook that links goals to everyday decisions.
Pair an annual budget with rolling forecasts so your company stays focused and agile all year. Use variance analysis and KPI tracking to spot trends early and protect outcomes.
Consolidate timely data, set short review cycles, and give teams clear ownership. This helps your business make faster, smarter decisions with fewer surprises.
Apply the steps here to build your next fiscal year plan with confidence. Start small, keep the process repeatable, and measure progress so finance and delivery move toward shared goals.
FAQs
What’s the main difference between a budget target and a forecasted outcome?
›
A budget target is the goal you set at the start of the year, while a forecasted outcome reflects what is actually likely to happen based on current performance and updated data.
How often should service businesses update their forecasts?
›
Most service businesses benefit from monthly updates, especially if project timelines, utilization, or sales cycles shift quickly. Quarterly updates work for slower-moving teams.
How far ahead should a service business forecast?
›
A 12-month rolling forecast is ideal because it keeps the outlook fresh, but many teams also maintain a shorter 3–6 month operational forecast for capacity planning.
What data sources do service businesses need for accurate forecasting?
›
You need consistent inputs from your CRM (pipeline), ERP (actuals and revenue), HR system (headcount and cost), and delivery tools (utilization and backlog).
Should service businesses budget by project, client, or department?
›
Most do a hybrid. Departments set spending and staffing targets, while revenue is budgeted by service line or project type to reflect delivery patterns.
How do you handle unexpected expenses in a service-business budget?
›
You include a small contingency or buffer and use variance analysis to decide whether to adjust spending, reallocate funds, or update the forecast.
What happens if your forecast is consistently inaccurate?
›
It usually means one of the drivers (utilization, pipeline conversion, pricing, or staffing assumptions) is wrong or outdated. Reviewing assumptions will improve accuracy.


.webp)
